空间数据往往很大,将其渲染在前端页面存在一定的难度
本文使用开源数据集,基于PostGIS、GeoServer、OpenLayers,探索并实验了一些百万级别的空间数据可视化方法
数据来源:SNAP: Network datasets: Gowalla (stanford.edu)
Gowalla数据集中共有6,442,890次签到,即6,442,890个点,文件大小约为376MB,文件格式为.txt
示例数据及字段:
[user] [check-in time] [latitude] [longitude] [location id] 196514 2010-07-24T13:45:06Z 53.3648119 -2.2723465833 145064 196514 2010-07-24T13:44:58Z 53.360511233 -2.276369017 1275991 196514 2010-07-24T13:44:46Z 53.3653895945 -2.2754087046 376497 196514 2010-07-24T13:44:38Z 53.3663709833 -2.2700764333 98503 196514 2010-07-24T13:44:26Z 53.3674087524 -2.2783813477 1043431 196514 2010-07-24T13:44:08Z 53.3675663377 -2.278631763 881734 196514 2010-07-24T13:43:18Z 53.3679640626 -2.2792943689 207763 196514 2010-07-24T13:41:10Z 53.364905 -2.270824 1042822复制
在QGIS中的可视化:
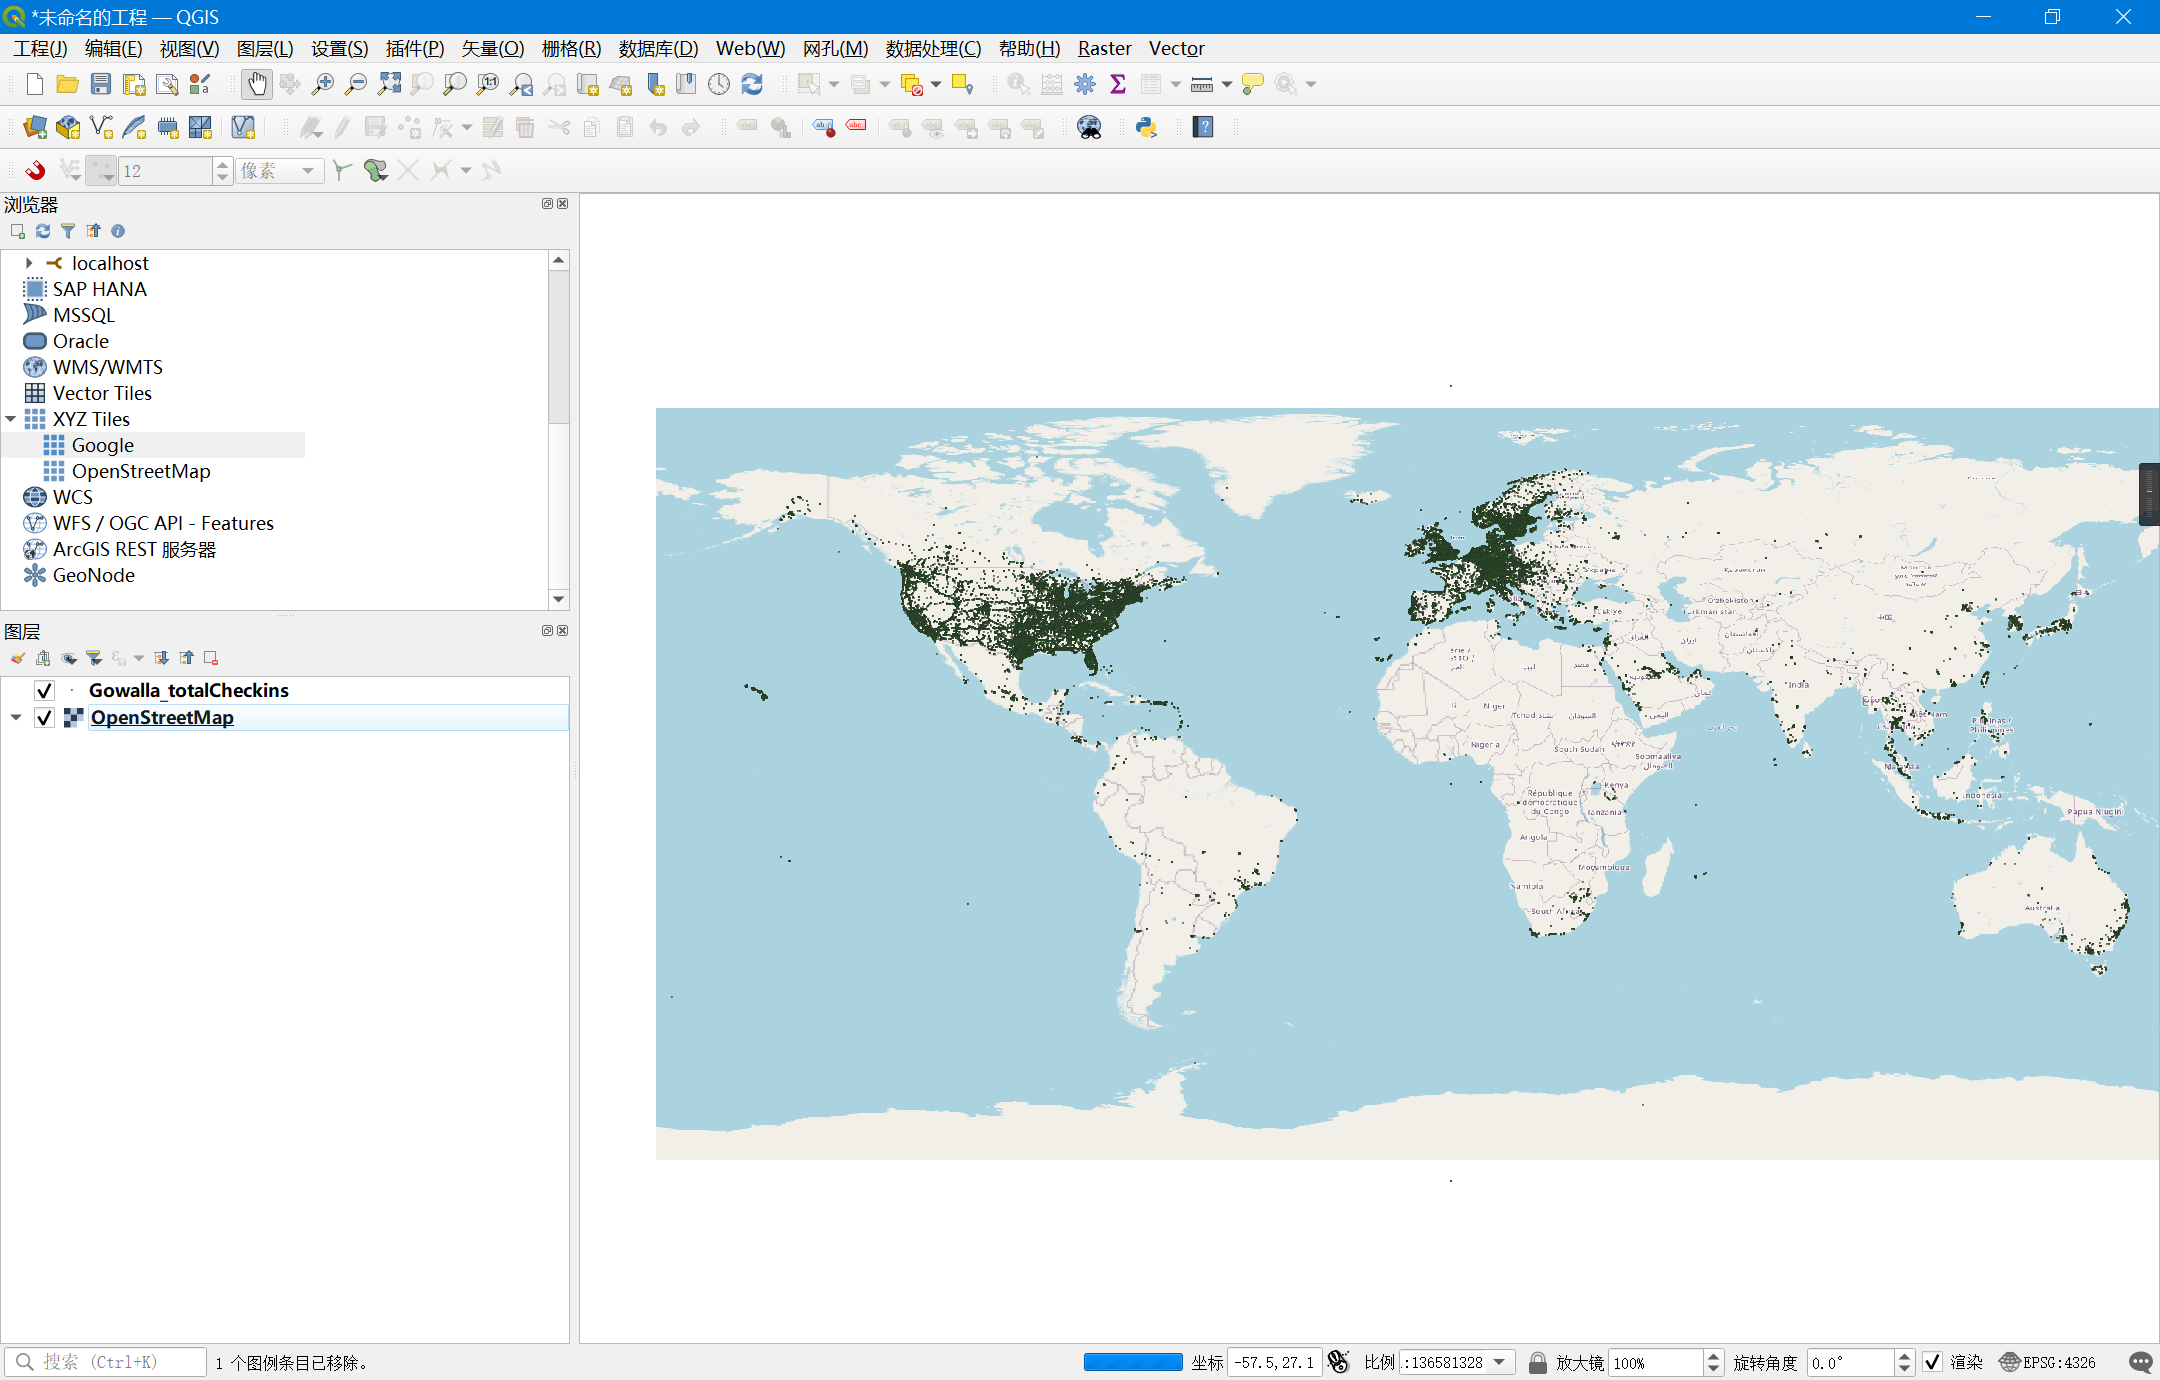
根据示例数据,可以发现原始文件Gowalla_totalCheckins.txt以tab符分割,属于csv格式
csv导入数据库是比较方便的,笔者这里使用pgAdmin,在Postgresql(带PostGIS扩展)里创建表,然后导入数据文件
数据表创建字段如下:
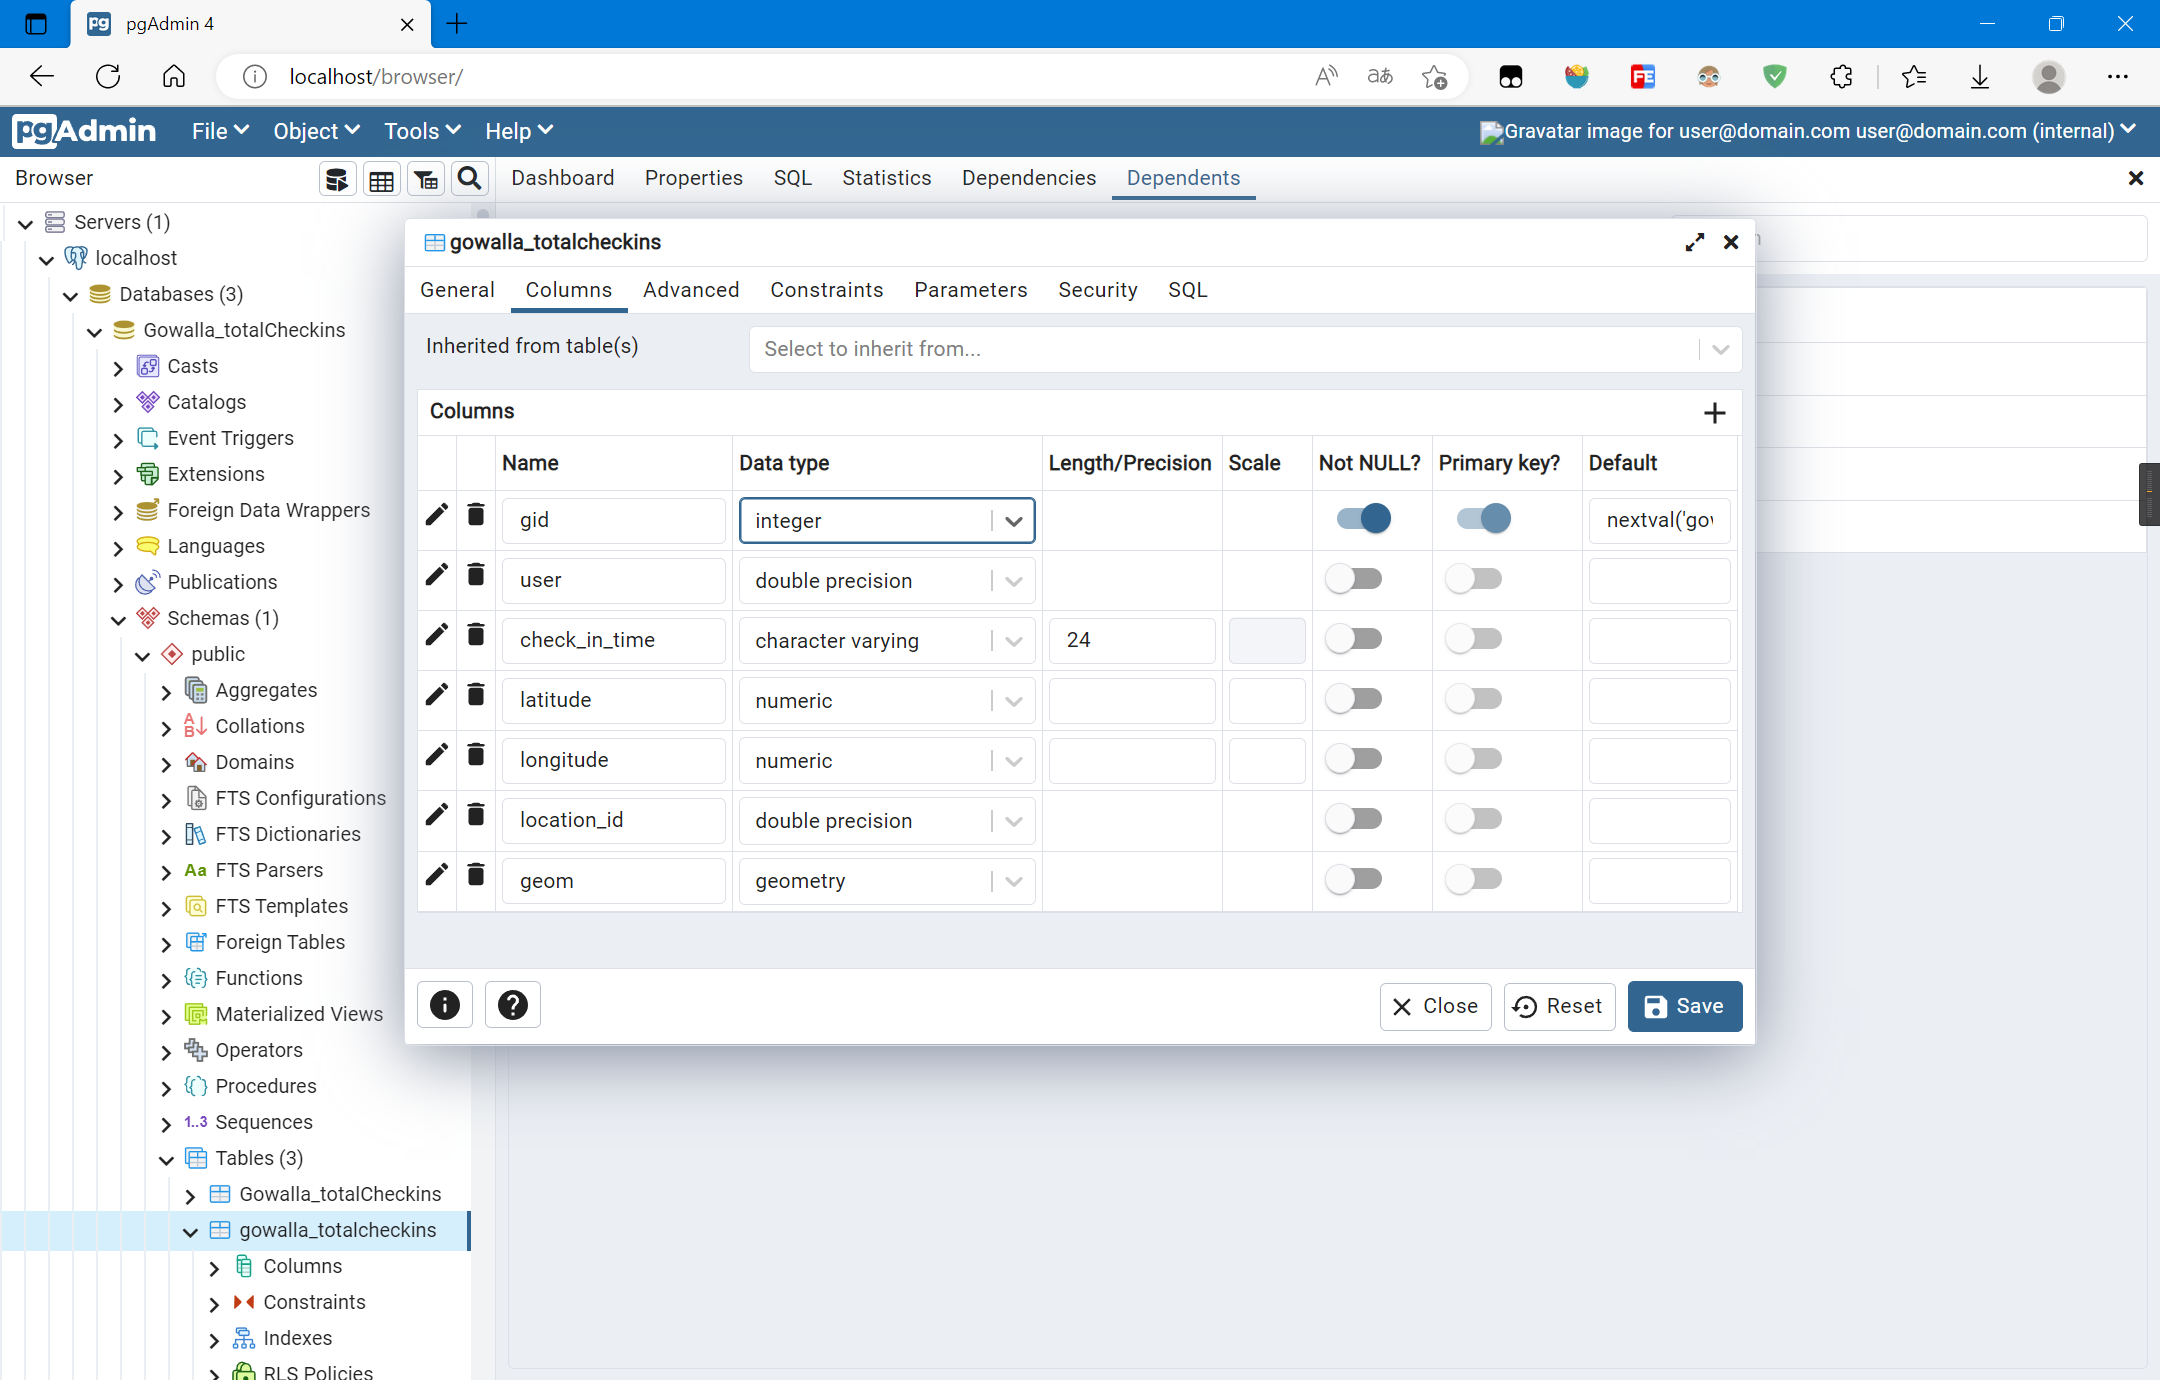
对应的SQL语句(使用pgAdmin导出):
CREATE TABLE IF NOT EXISTS public.gowalla_totalcheckins
(
    gid integer NOT NULL DEFAULT nextval('gowalla_totalcheckins_gid_seq'::regclass),
    "user" double precision,
    check_in_time character varying(24) COLLATE pg_catalog."default",
    latitude numeric,
    longitude numeric,
    location_id double precision,
    geom geometry(Point),
    CONSTRAINT gowalla_totalcheckins_pkey PRIMARY KEY (gid)
)
复制
加载PostGIS扩展:
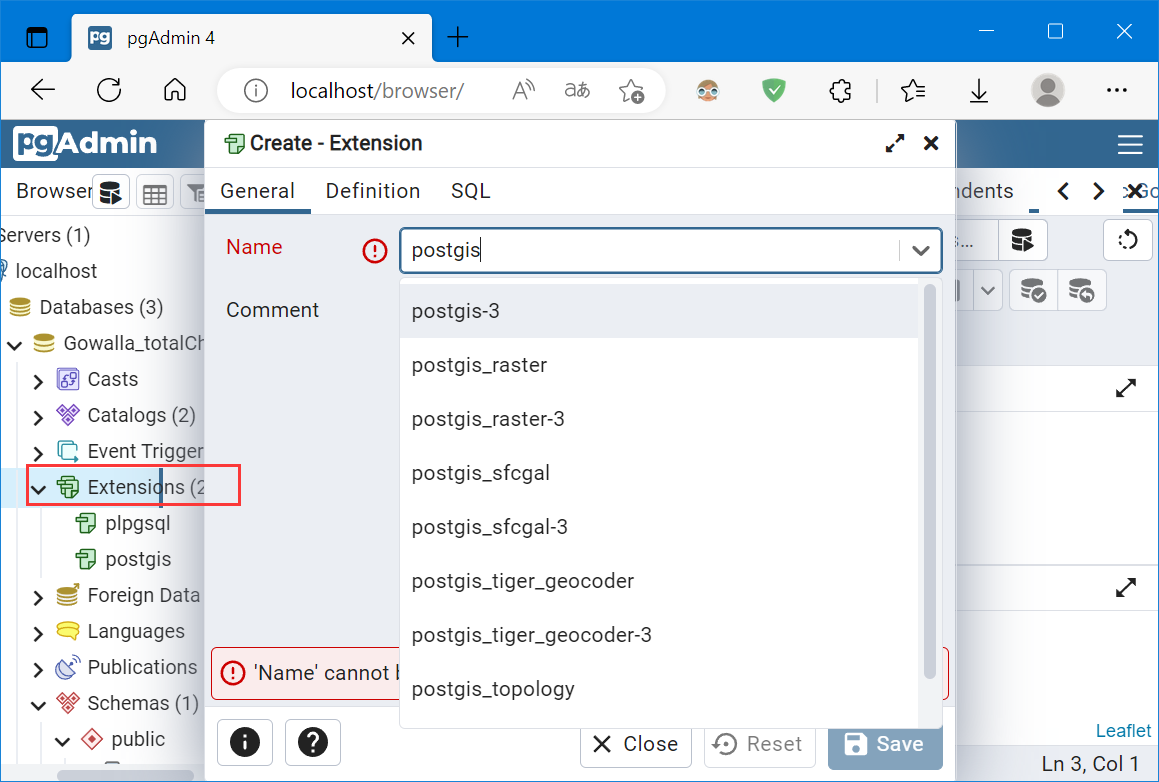
对应的SQL语句:
CREATE EXTENSION "postgis";
复制选中数据表,点击Tools下的Import/Export Data
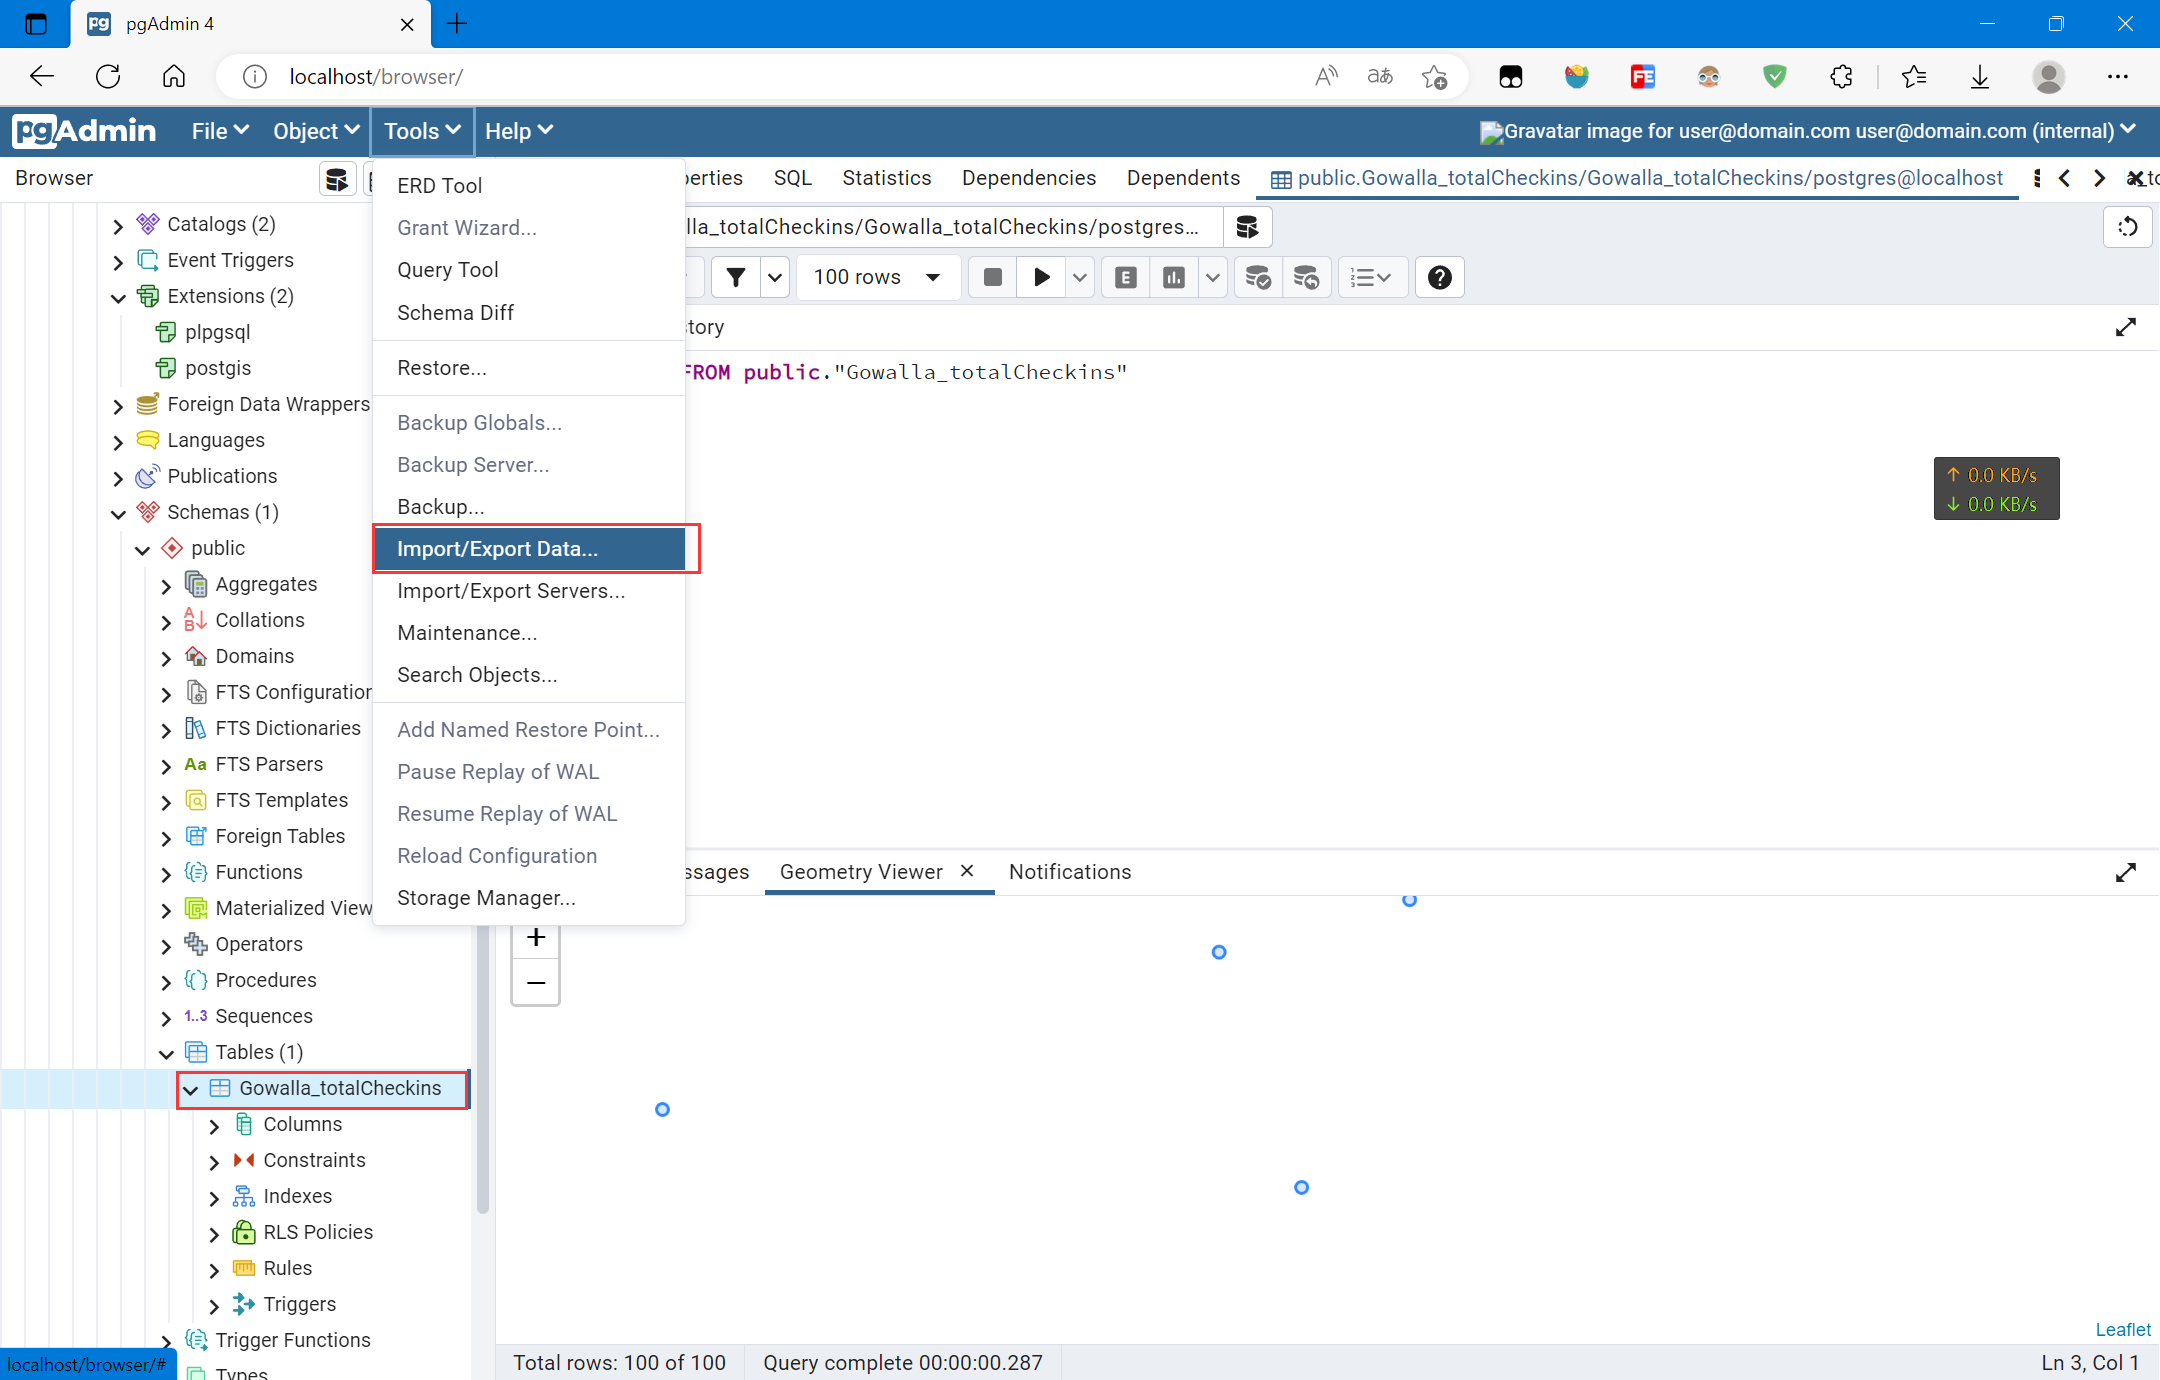
选择导入的文件Gowalla_totalCheckins.txt,然后设置分隔符为tab,导入即可:
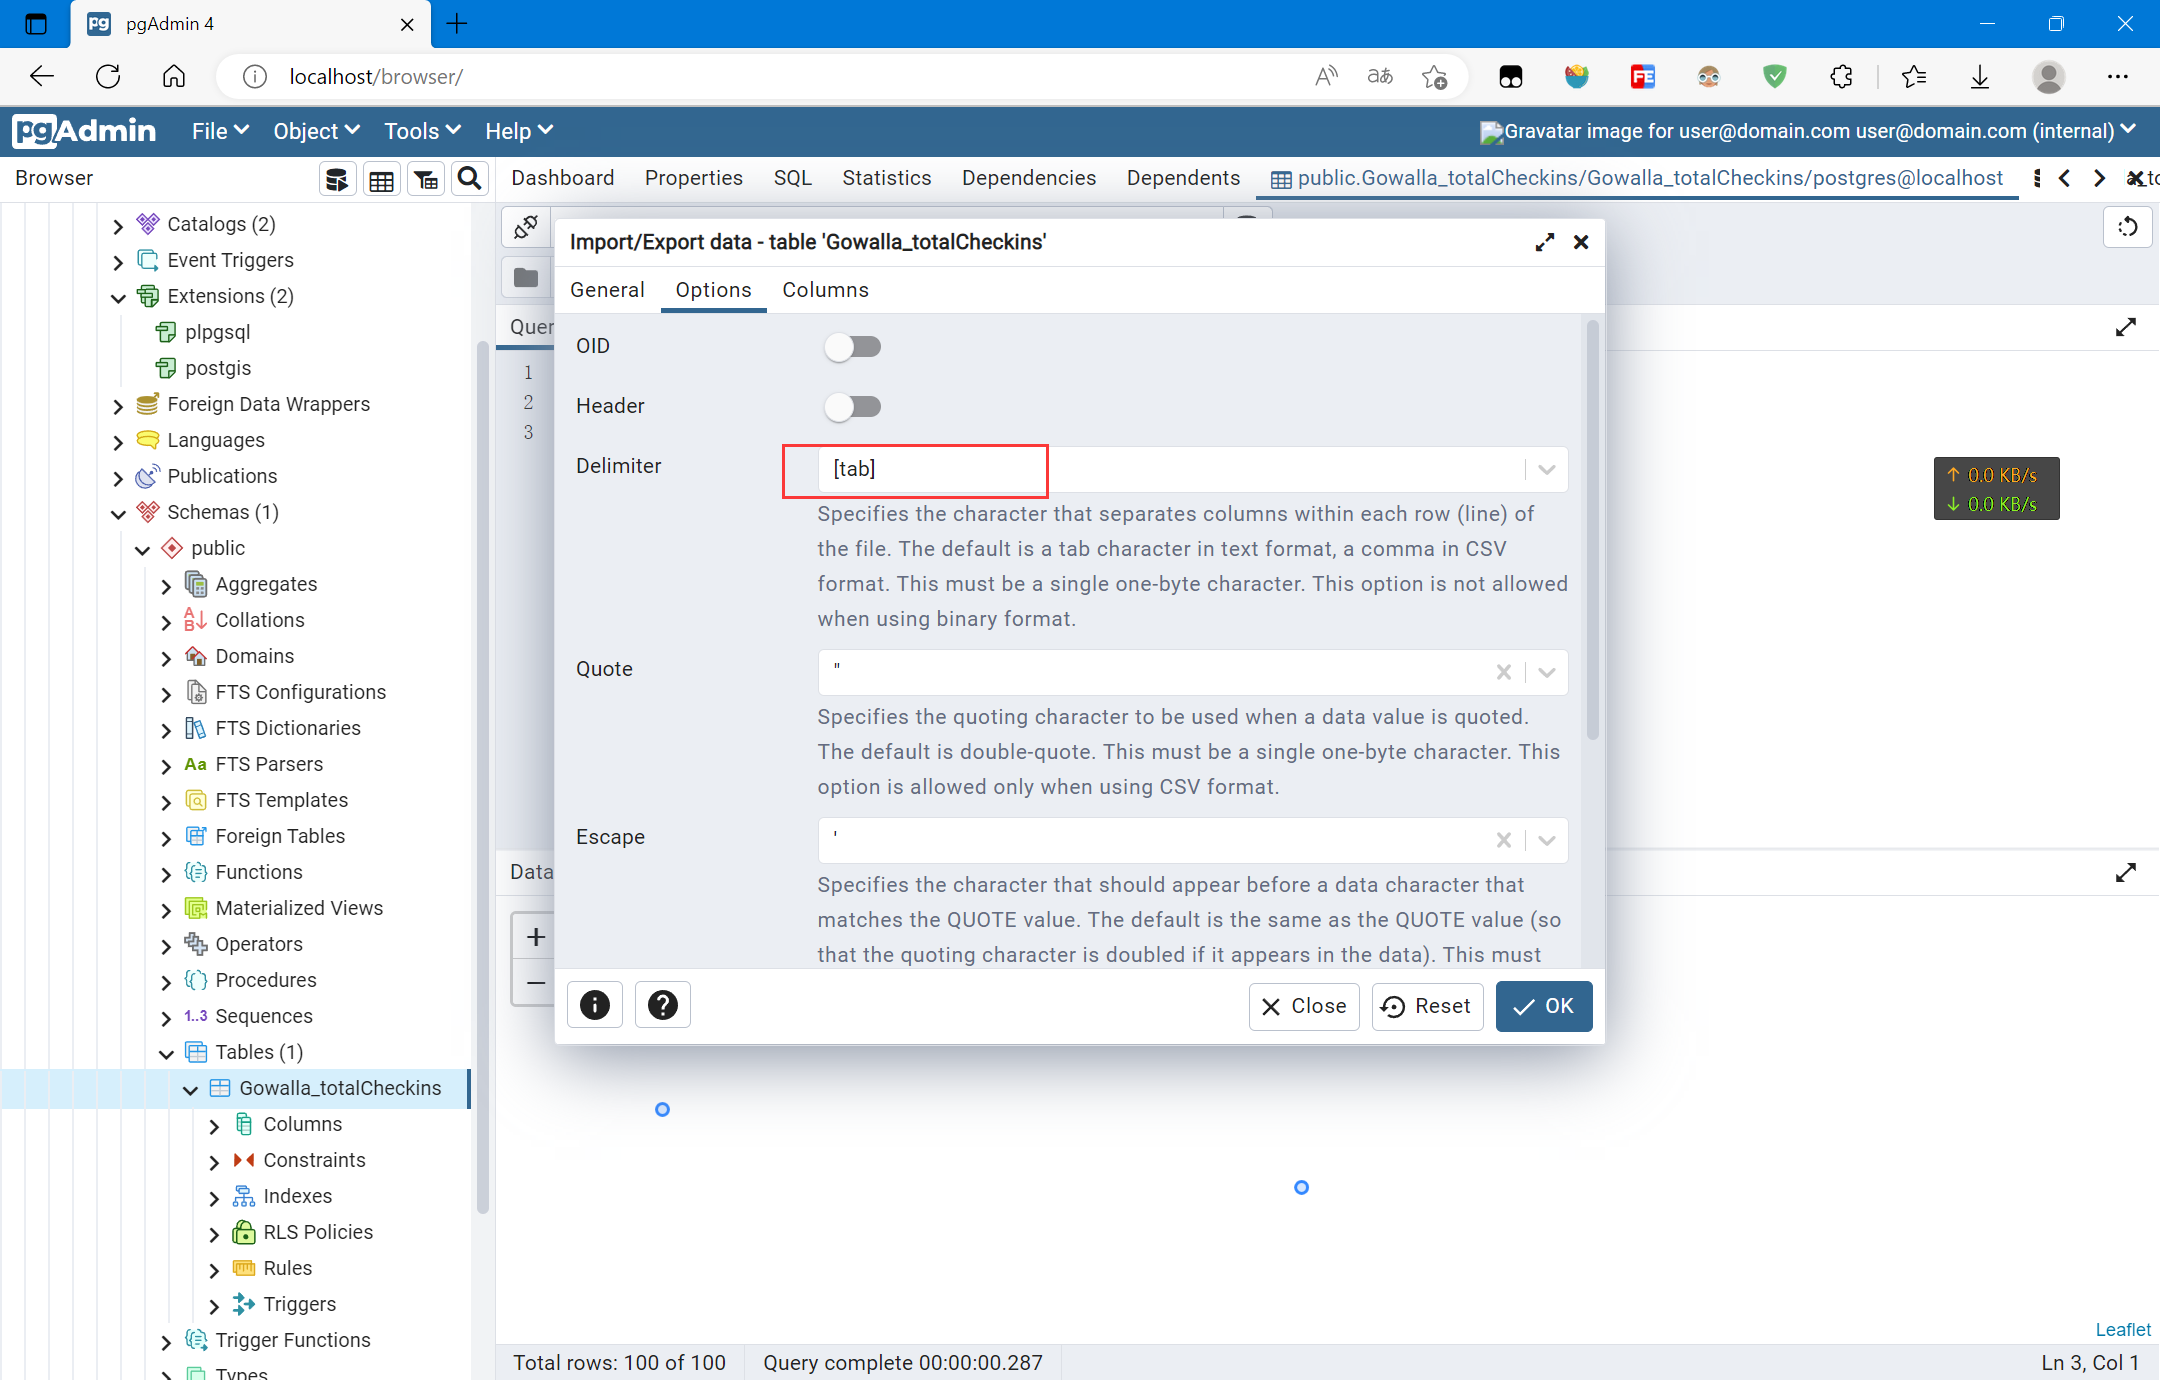
...中的upload,将本地文件上传,如果文件大小被限制,可以在设置(preferences)中修改设置几何(Geometry)列:
UPDATE public.gowalla_totalcheckins SET geom = ST_SetSRID(ST_MakePoint(longitude,latitude), 4326);
复制
创建空间索引,加快空间查询:
CREATE INDEX gowalla_totalcheckins_geom_idx ON public.gowalla_totalcheckins USING gist (geom);
复制使用pgAdmin查询数据并可视化空间数据(部分):
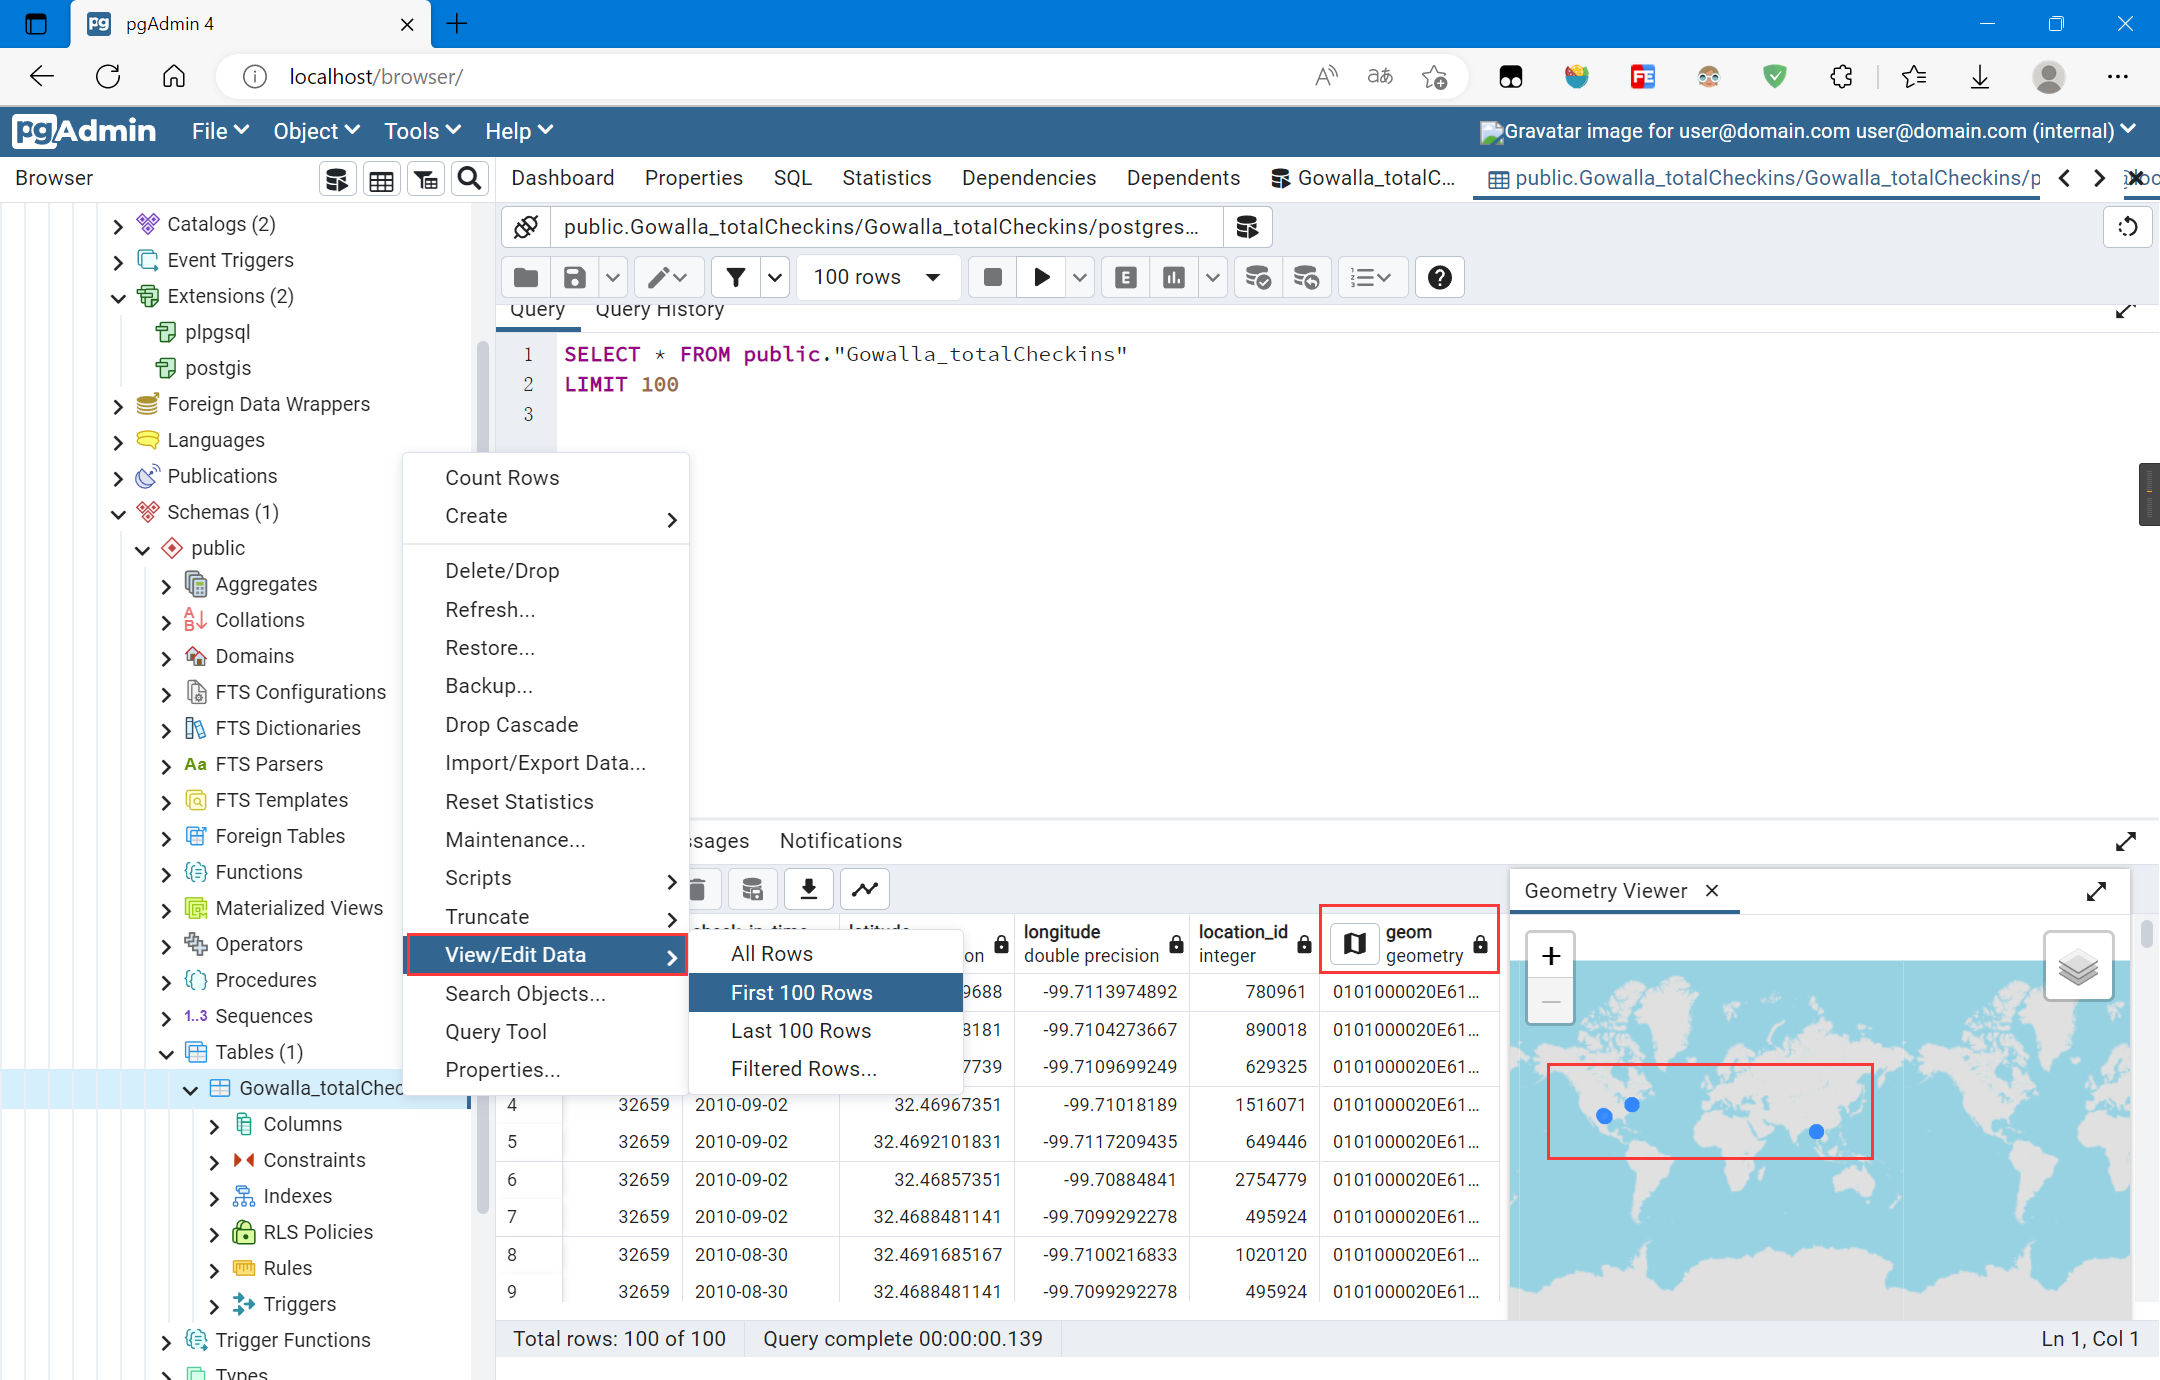
对应的SQL语句为:
SELECT * FROM public.gowalla_totalcheckins LIMIT 100
复制经度不属于-180至180,纬度不属于-90至90的数据,认为是异常值
查询异常值:
SELECT * FROM public.gowalla_totalcheckins WHERE latitude>90 OR latitude<-90 OR longitude>180 OR longitude<-180;
复制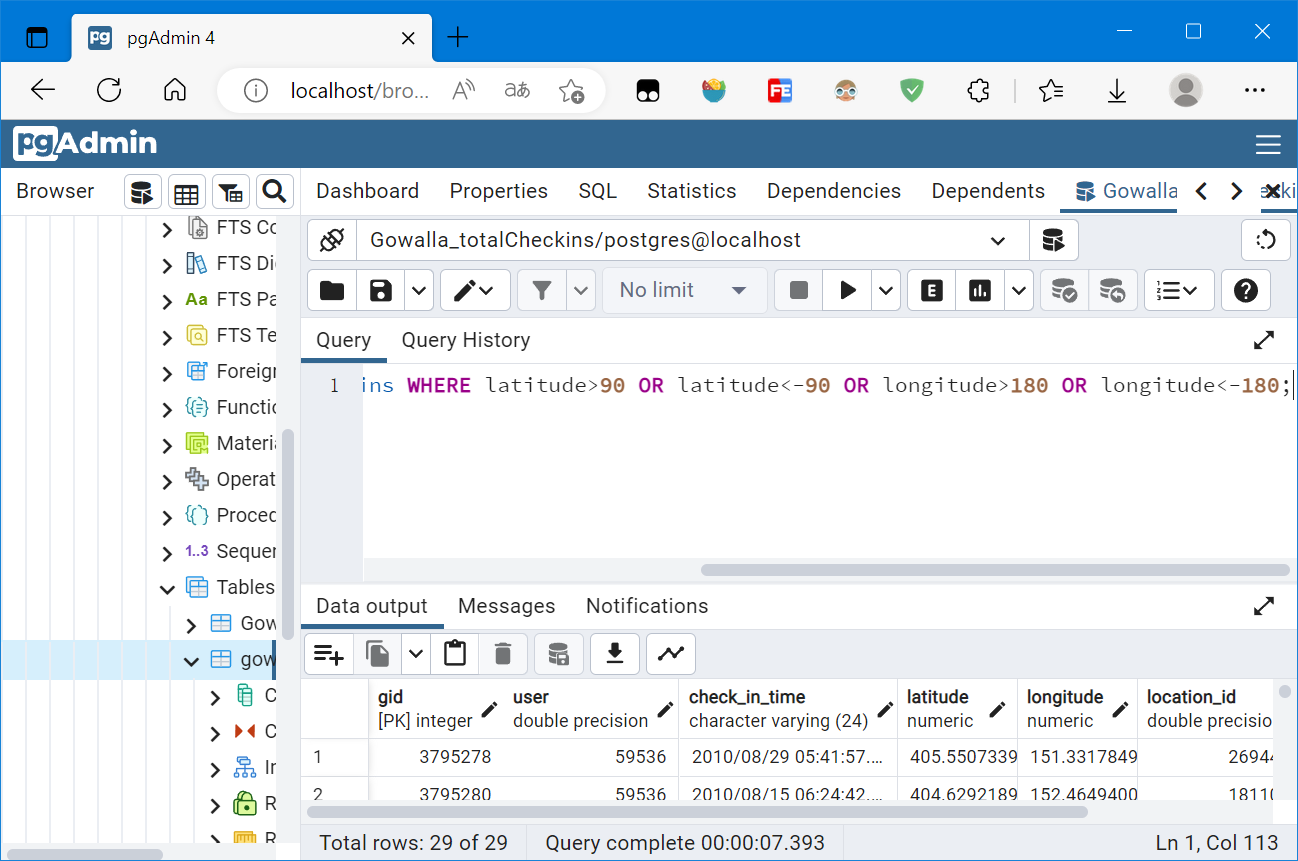
删除异常值:
DELETE FROM public.gowalla_totalcheckins WHERE latitude>90 OR latitude<-90 OR longitude>180 OR longitude<-180;
复制空间数据存储数据库后,可以选择编写后端来接受请求发送数据,更一般的,是使用GIS服务器发布数据
这里是使用的GIS服务器是GeoServer
使用Geoserver将PostGIS中的签到数据发布可以参考:基于PostGIS使用GeoServer发布数据量大的GPS轨迹路线图 - 当时明月在曾照彩云归 - 博客园 (cnblogs.com)
总的来说,流程就是:
添加工作区(可选项)
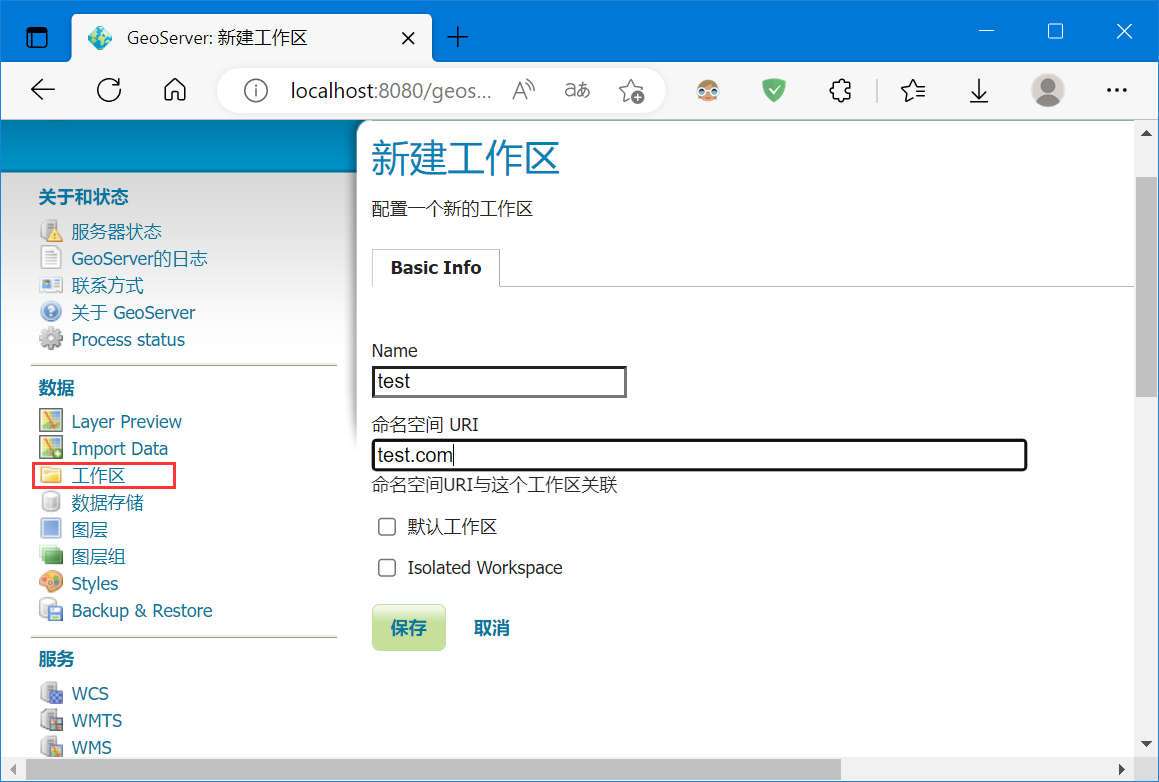
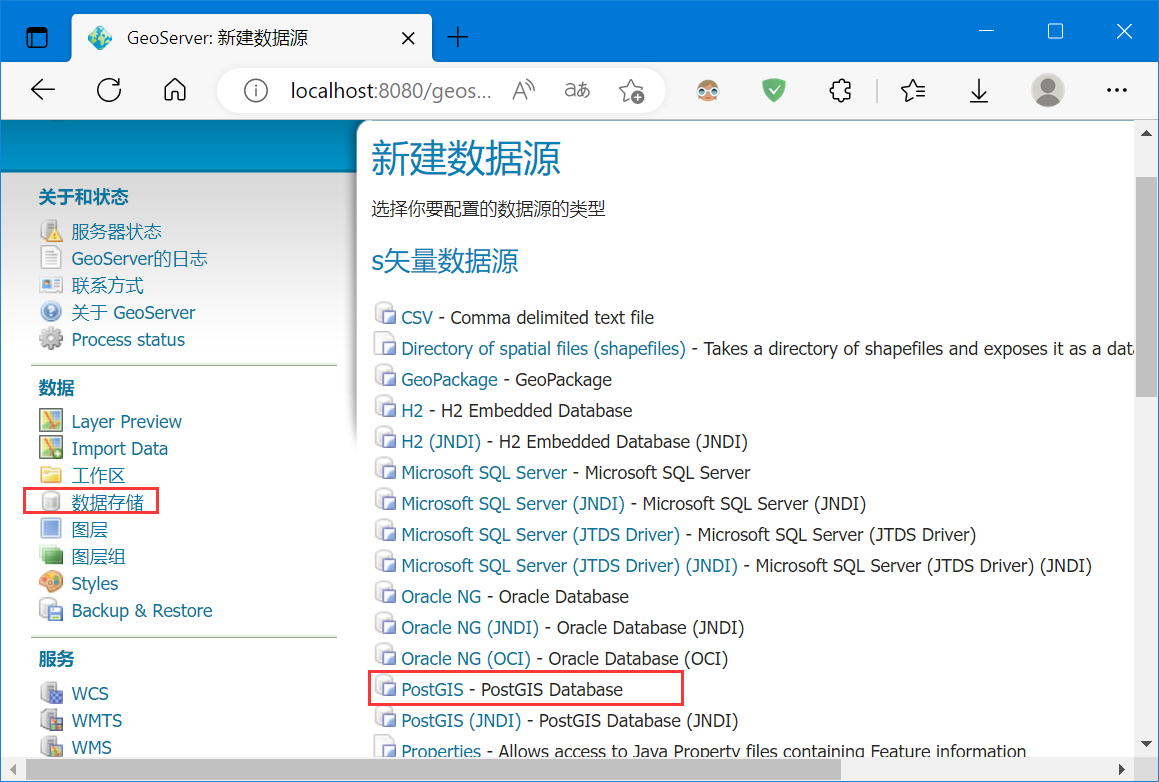
添加数据存储,设置相应数据库参数:
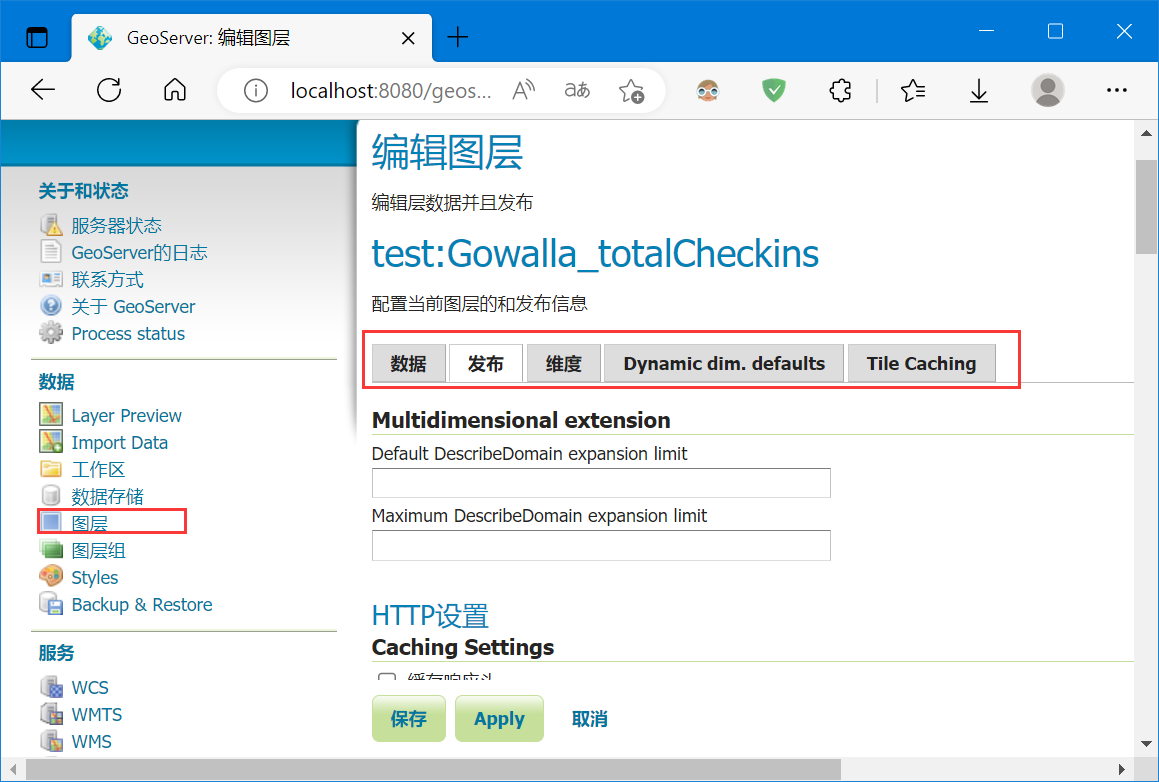
编辑参数发布图层:
这里使用OpenLayers 6 进行前端可视化渲染,数据选择一百万个点
使用OpenLayers比较传统的渲染方式,即canvas渲染,代码如下:
<!DOCTYPE html>
<html lang="en">

<head>
    <meta charset="UTF-8">
    <meta http-equiv="X-UA-Compatible" content="IE=edge">
    <meta name="viewport" content="width=device-width, initial-scale=1.0">
    <title>Document</title>
    <!-- openlayers cdn -->
    <link rel="stylesheet"
        href="https://cdn.jsdelivr.net/gh/openlayers/openlayers.github.io@master/en/v6.15.1/css/ol.css" type="text/css">
    <script src="https://cdn.jsdelivr.net/gh/openlayers/openlayers.github.io@master/en/v6.15.1/build/ol.js"></script>
    <style>
        html,
        body {
            height: 100%;
        }

        body {
            margin: 0;
            padding: 0;
        }

        #map {
            height: 100%;
        }
    </style>
</head>

<body>
    <div id="map"></div>

    <script>
        var map = new ol.Map({
            target: 'map',
            layers: [],
            view: new ol.View({
                center: [112.644, 30.5158],
                zoom: 2,
                projection: 'EPSG:4326'
            })
        });
        const vectorLayer = new ol.layer.Vector({
            source: new ol.source.Vector({
                url: 'http://127.0.0.1:8080/geoserver/test/ows?service=WFS&version=1.0.0&request=GetFeature&typeName=test%3AGowalla_totalCheckins&maxFeatures=1000000&outputFormat=application%2Fjson',
                format: new ol.format.GeoJSON()
            }),
            style: new ol.style.Style({
                image: new ol.style.Circle({
                    radius: 4,
                    fill: new ol.style.Fill({
                        color: [255, 0, 0, 0.2],
                    }),
                })
            }),
        });
        map.addLayer(vectorLayer);
    </script>
</body>

</html>
复制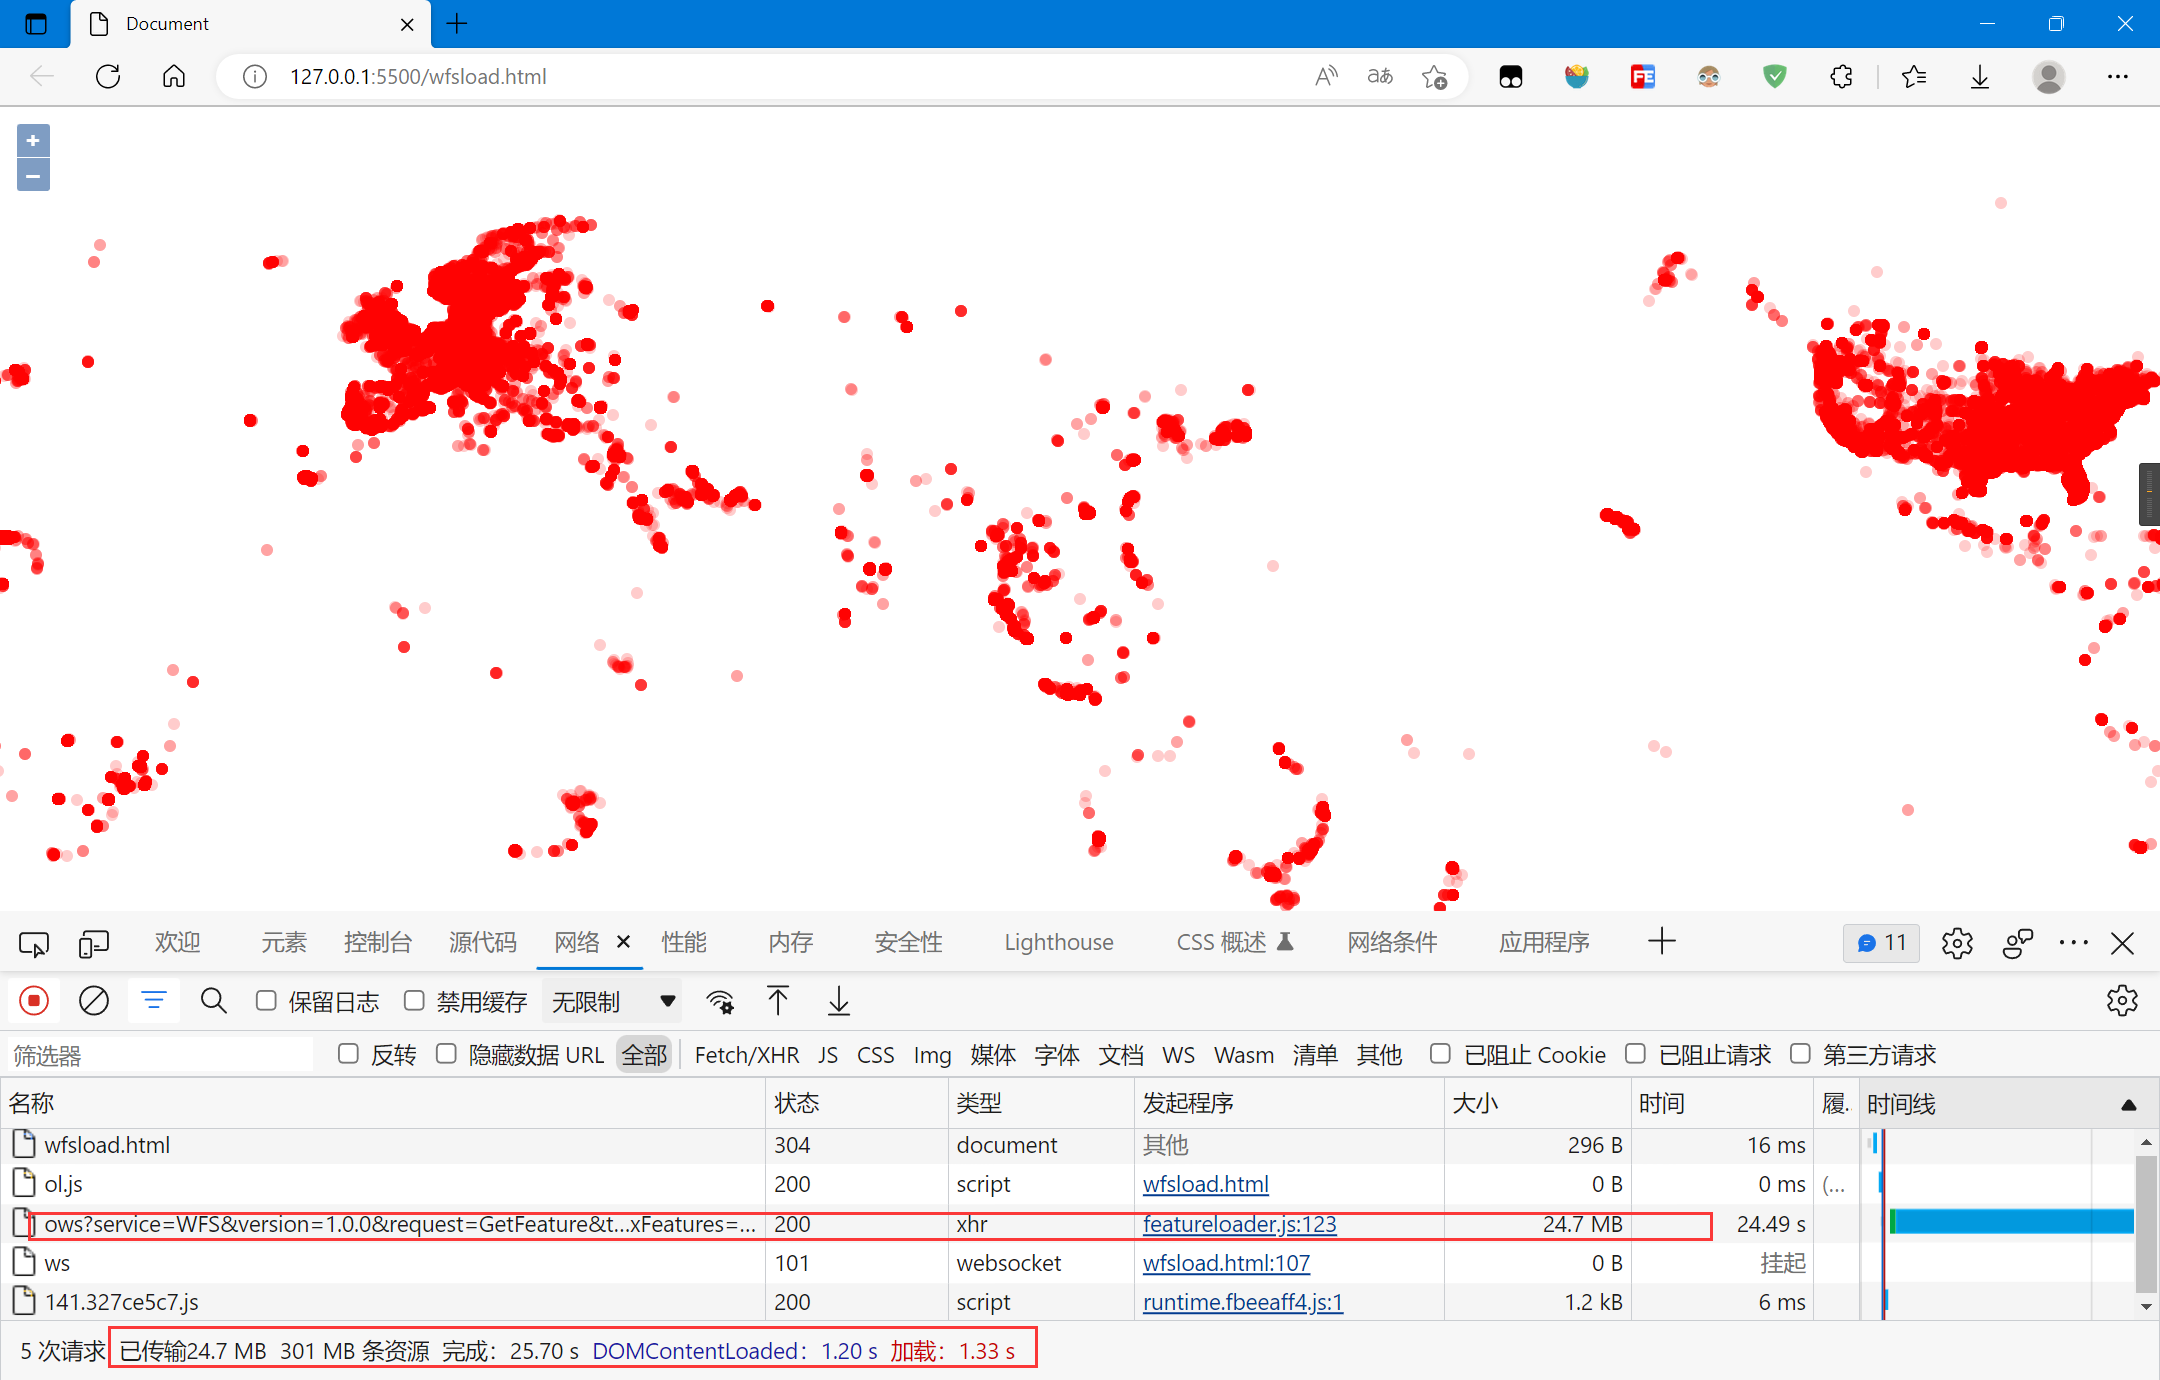
数据一次性传输完成,CPU占用较高,绘制时间较长,很卡顿
使用WebGL的方式进行渲染:
<!DOCTYPE html>
<html lang="en">

<head>
    <meta charset="UTF-8">
    <meta http-equiv="X-UA-Compatible" content="IE=edge">
    <meta name="viewport" content="width=device-width, initial-scale=1.0">
    <title>Document</title>
    <!-- openlayers cdn -->
    <link rel="stylesheet"
        href="https://cdn.jsdelivr.net/gh/openlayers/openlayers.github.io@master/en/v6.15.1/css/ol.css" type="text/css">
    <script src="https://cdn.jsdelivr.net/gh/openlayers/openlayers.github.io@master/en/v6.15.1/build/ol.js"></script>
    <style>
        html,
        body {
            height: 100%;
        }

        body {
            margin: 0;
            padding: 0;
        }

        #map {
            height: 100%;
        }
    </style>
</head>

<body>
    <div id="map"></div>

    <script>
        var map = new ol.Map({
            target: 'map',
            layers: [],
            view: new ol.View({
                center: [112.644, 30.5158],
                zoom: 2,
                projection: 'EPSG:4326'
            })
        });

        const vectorLayer = new ol.layer.WebGLPoints({
            source: new ol.source.Vector({
                url: 'http://127.0.0.1:8080/geoserver/test/ows?service=WFS&version=1.0.0&request=GetFeature&typeName=test%3AGowalla_totalCheckins&maxFeatures=1000000&outputFormat=application%2Fjson',
                format: new ol.format.GeoJSON()
            }),
            style: {
                symbol: {
                    symbolType: 'circle',
                    size: 8,
                    color: 'rgb(255, 0, 0)',
                    opacity: 0.2,
                },
            }
        })
        map.addLayer(vectorLayer);
    </script>
</body>

</html>
复制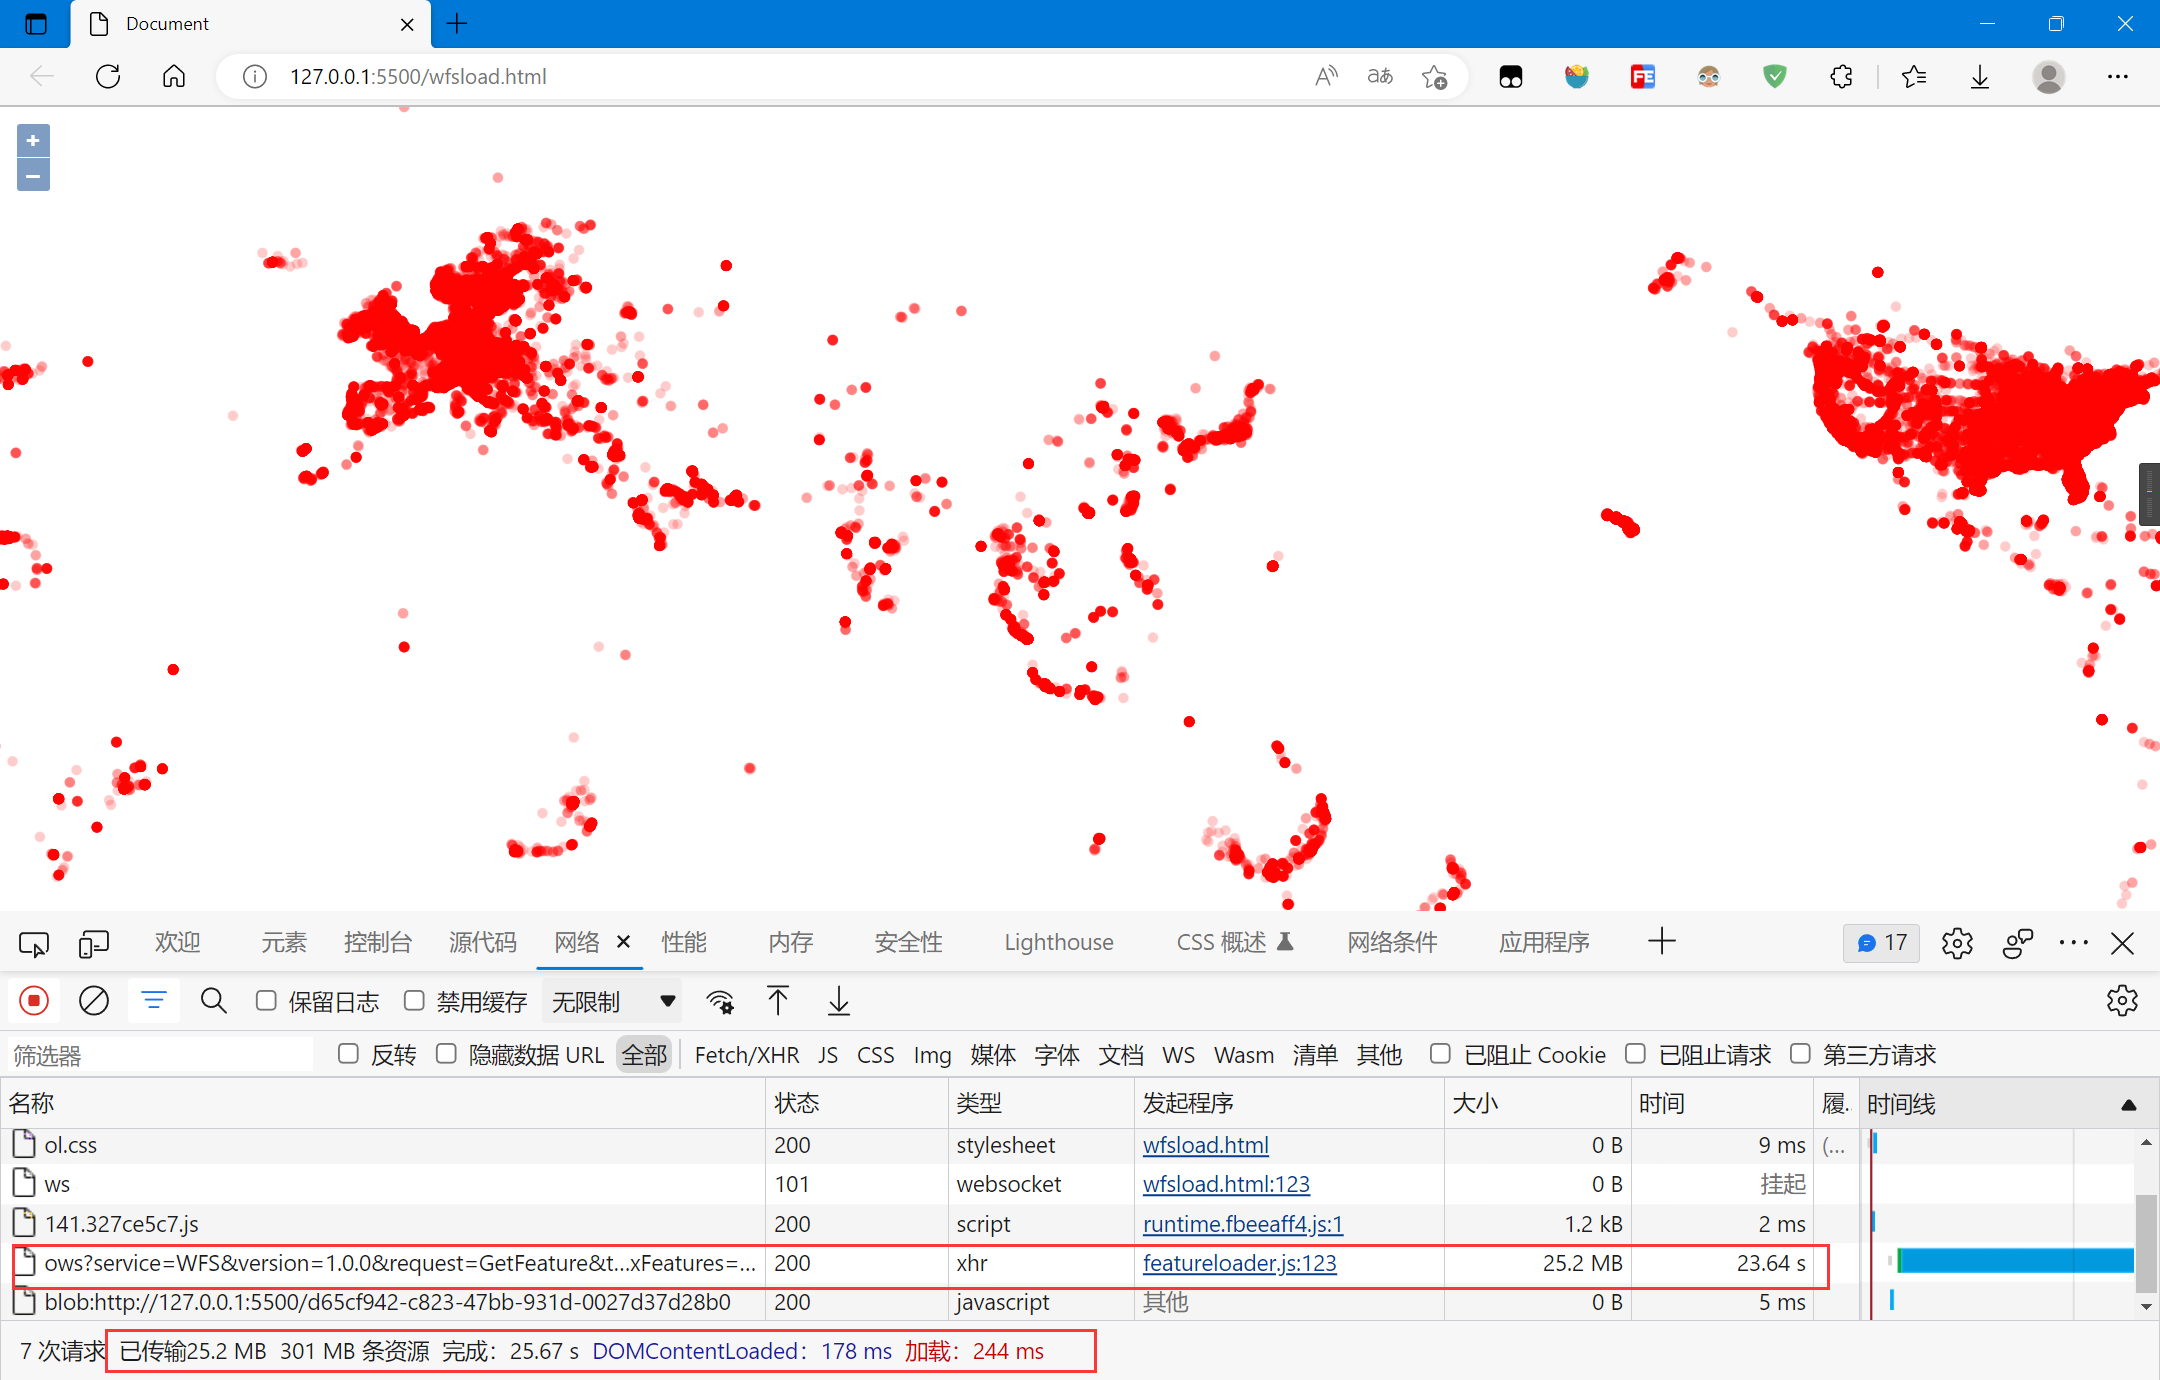
数据一次性传输完成,CPU和GPU在绘制时都有占用,绘制时间较长,有一点卡顿,但比基于CPU的方式好很多
所以,渲染大数据时尽量使用WebGL的方式
屏幕的显示是有限的,人眼可见的范围也是有限的,不需要一次性绘制完所有数据
数据聚合,就是在不同缩放等级下将数据抽稀再渲染
使用OpenLayers中的聚合函数再使用WebGL的方式渲染:
<!DOCTYPE html>
<html lang="en">

<head>
    <meta charset="UTF-8">
    <meta http-equiv="X-UA-Compatible" content="IE=edge">
    <meta name="viewport" content="width=device-width, initial-scale=1.0">
    <title>Document</title>
    <!-- openlayers cdn -->
    <link rel="stylesheet"
        href="https://cdn.jsdelivr.net/gh/openlayers/openlayers.github.io@master/en/v6.15.1/css/ol.css" type="text/css">
    <script src="https://cdn.jsdelivr.net/gh/openlayers/openlayers.github.io@master/en/v6.15.1/build/ol.js"></script>
    <style>
        html,
        body {
            height: 100%;
        }

        body {
            margin: 0;
            padding: 0;
        }

        #map {
            height: 100%;
        }
    </style>
</head>

<body>
    <div id="map"></div>

    <script>
        var map = new ol.Map({
            target: 'map',
            layers: [],
            view: new ol.View({
                center: [112.644, 30.5158],
                zoom: 2,
                projection: 'EPSG:4326'
            })
        });

        const source = new ol.source.Vector({
            url: 'http://127.0.0.1:8080/geoserver/test/ows?service=WFS&version=1.0.0&request=GetFeature&typeName=test%3AGowalla_totalCheckins&maxFeatures=5000000&outputFormat=application%2Fjson',
            format: new ol.format.GeoJSON()
        })
        const clusterSource = new ol.source.Cluster({
            source: source,
        })

        map.addLayer(new ol.layer.WebGLPoints({
            source: clusterSource,
            style: {
                symbol: {
                    symbolType: 'circle',
                    size: 8,
                    color: 'rgb(255, 0, 0)',
                    opacity: 0.2,
                },
            }
        }));
    </script>
</body>

</html>
复制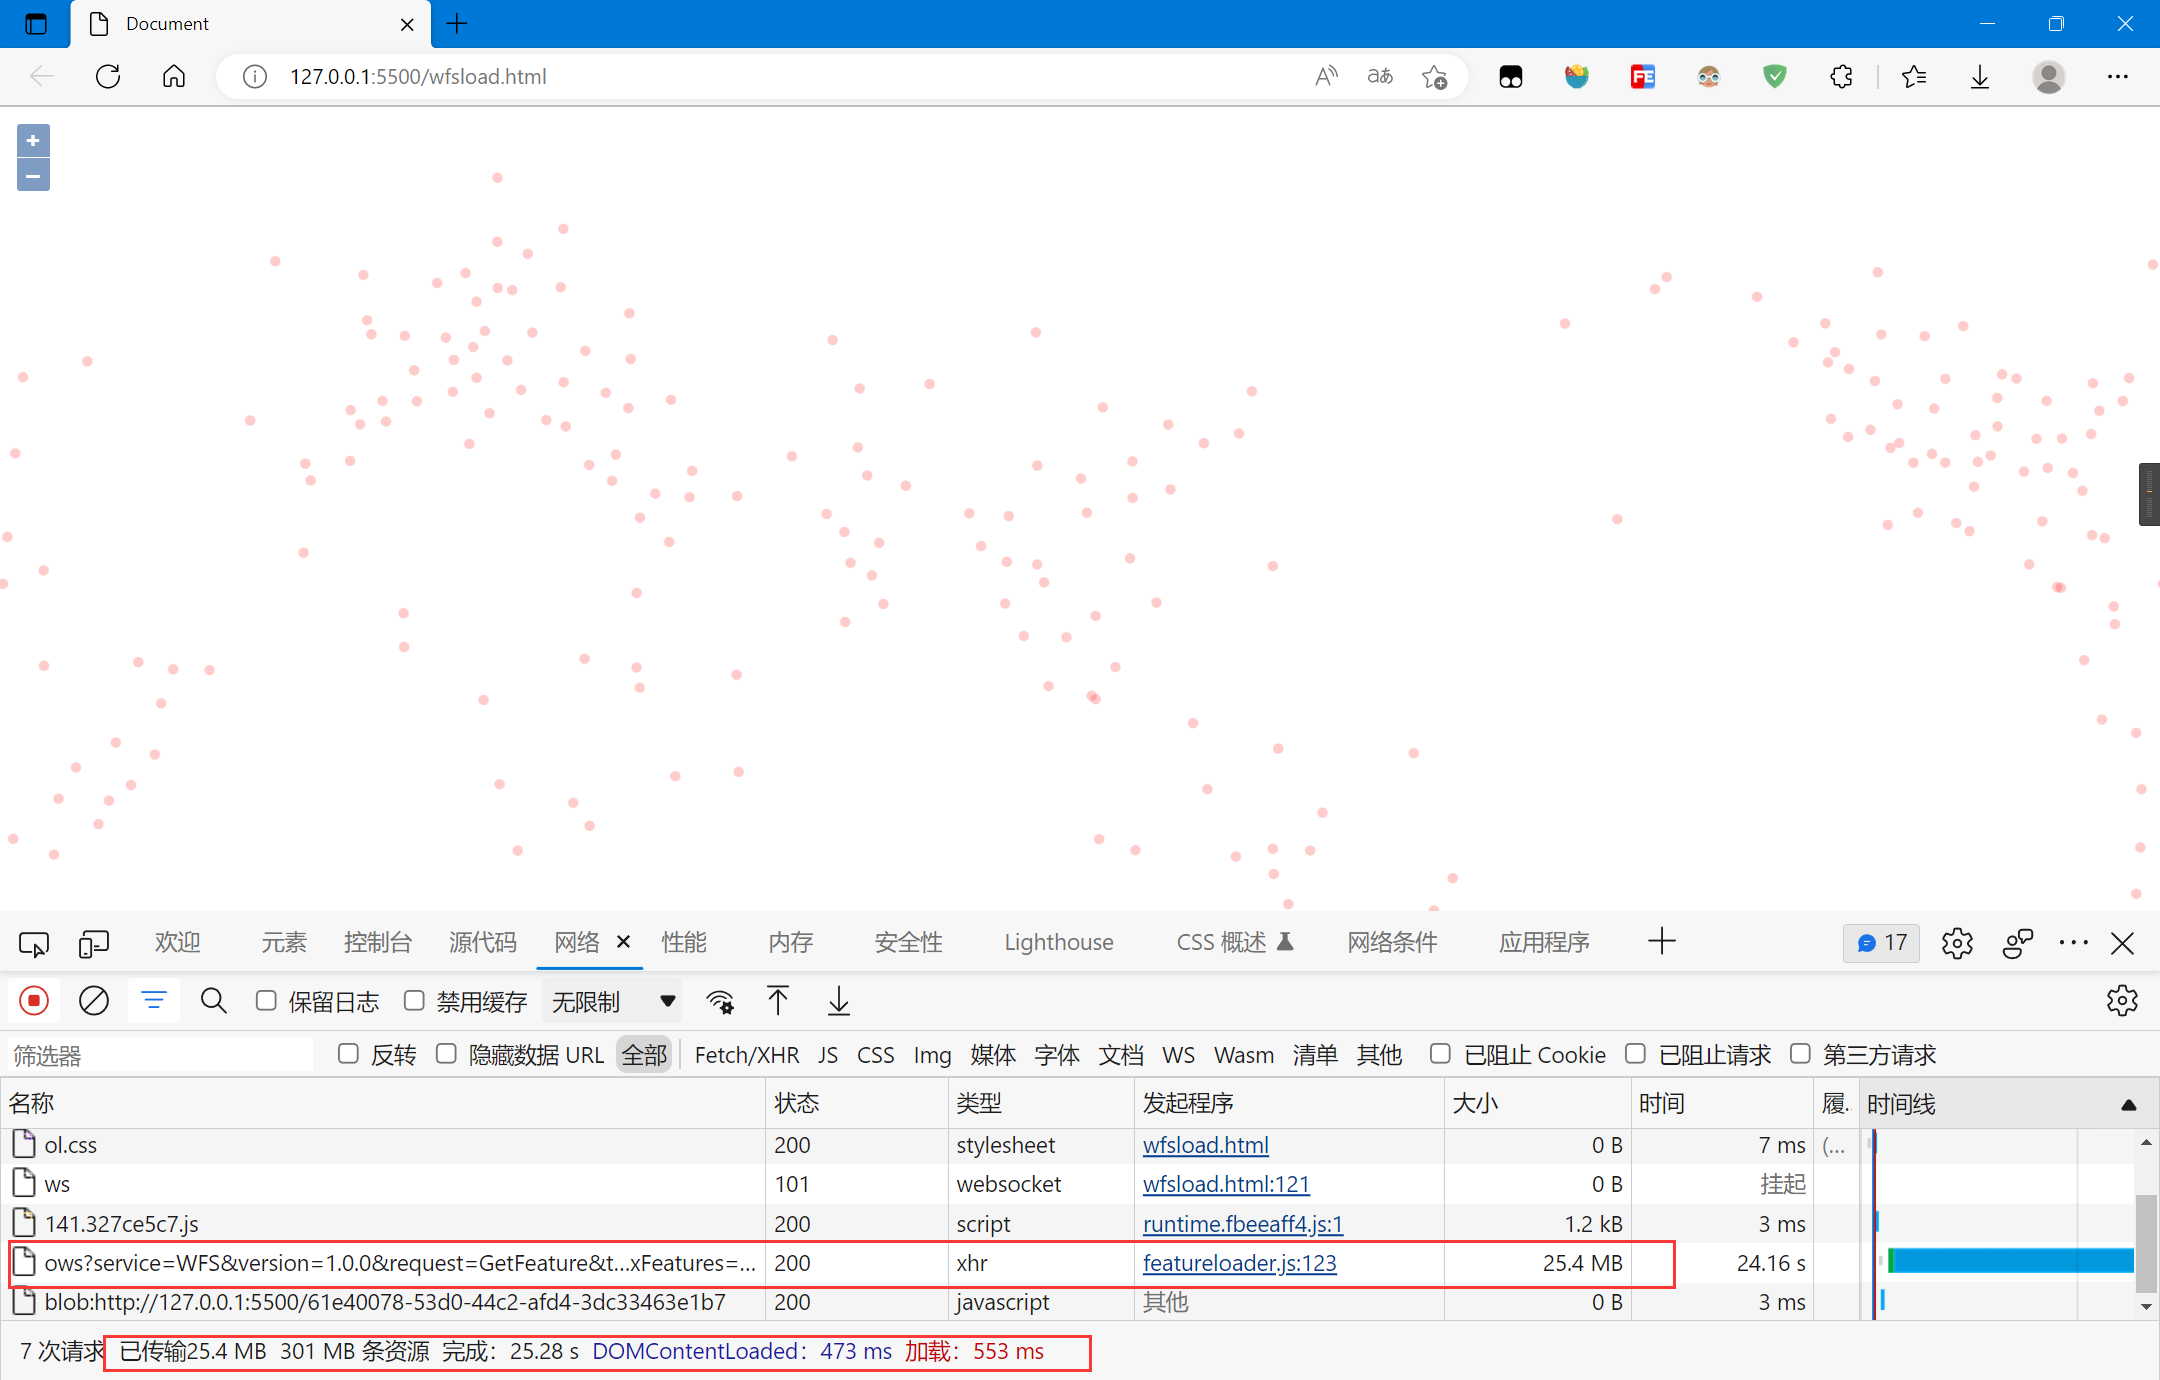
数据一次性传输完成,CPU和GPU在绘制时都有占用,绘制时间较长,缩放时有一点卡顿,CPU处理聚合函数需要一定的时间,GPU占用很低
地图平移还好,缩放时的卡顿感较强
GeoServer的矢量切片功能需要安装矢量切片扩展,具体可参考:
具体的矢量切片的使用步骤可以参考:
关于矢量切片工具GeoWebCache的使用可以参考:
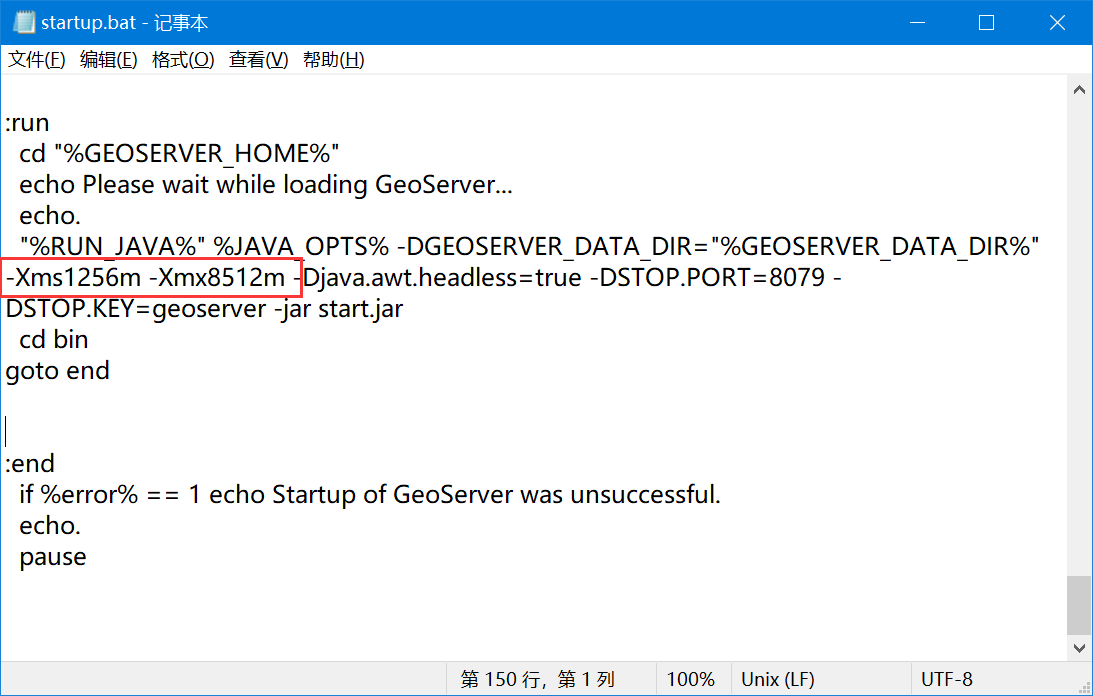
如果遇到了OOM错误,可以调节JVM参数,详细参考:
JVM参数可以设置在start.bat里,笔者这里提高了JVM内存,默认是系统内存的四分之一:
开始启动切片后,陷入了沉思:
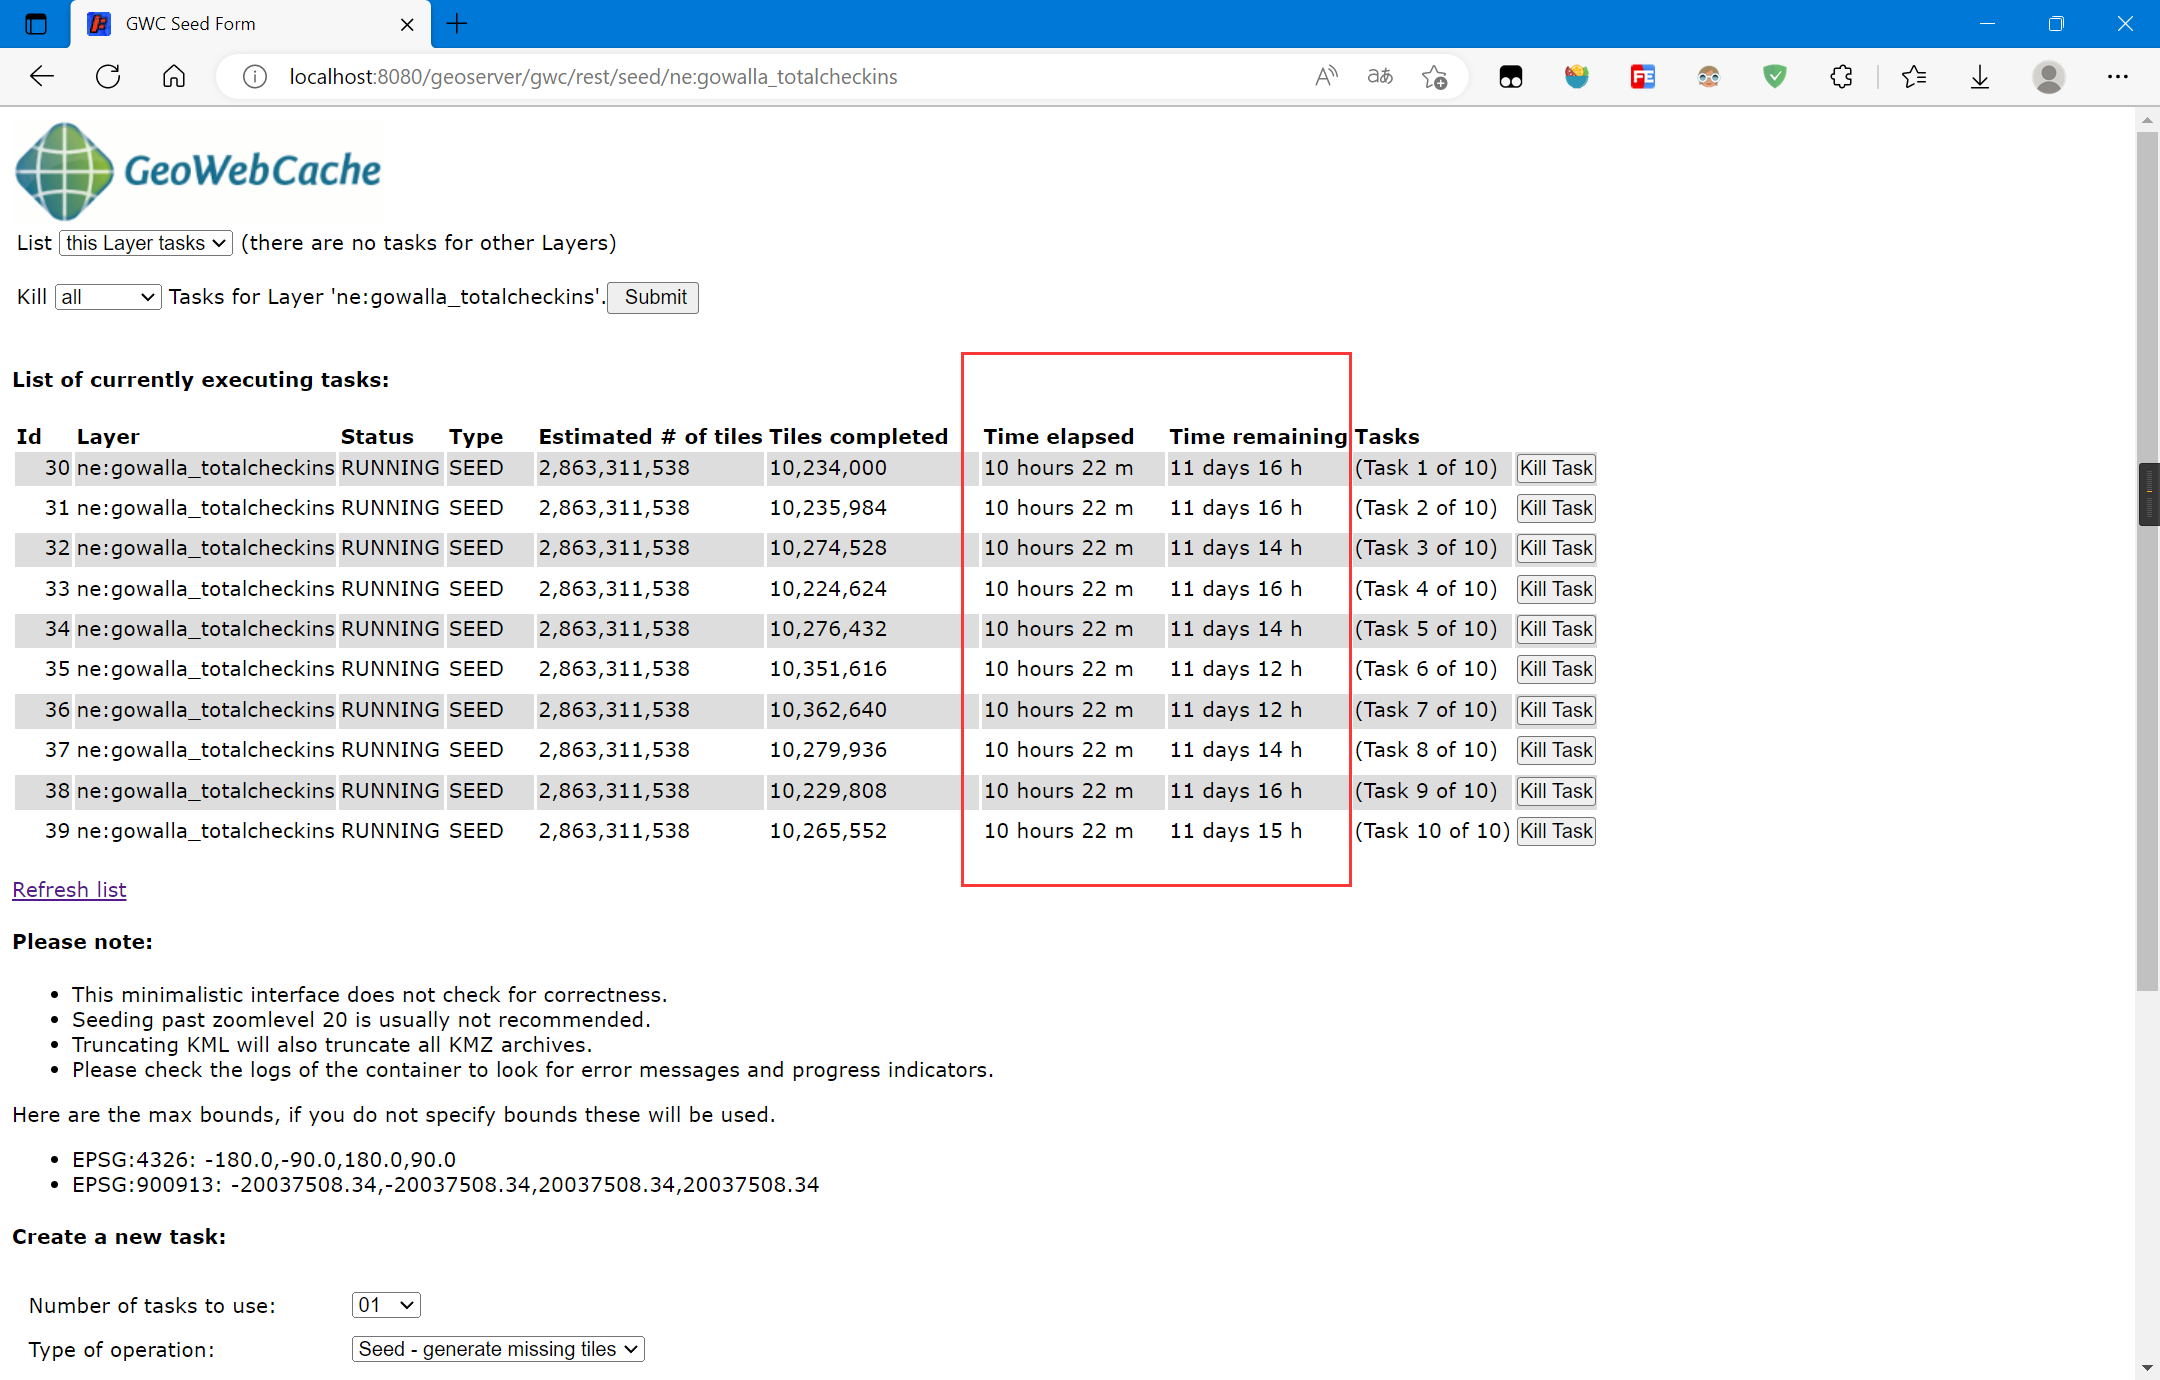
切片要12天?
OK,笔者先不切片或者切一部分,如果没有切片,GeoWebCache会在请求时进行切片并缓存
使用OpenLayers加载MVT矢量瓦片(.pbf):
<!DOCTYPE html>
<html lang="en">

<head>
    <meta charset="UTF-8">
    <meta http-equiv="X-UA-Compatible" content="IE=edge">
    <meta name="viewport" content="width=device-width, initial-scale=1.0">
    <title>Document</title>
    <!-- openlayers cdn -->
    <link rel="stylesheet"
        href="https://cdn.jsdelivr.net/gh/openlayers/openlayers.github.io@master/en/v6.15.1/css/ol.css" type="text/css">
    <script src="https://cdn.jsdelivr.net/gh/openlayers/openlayers.github.io@master/en/v6.15.1/build/ol.js"></script>
    <style>
        html,
        body {
            height: 100%;
        }

        body {
            margin: 0;
            padding: 0;
        }

        #map {
            height: 100%;
        }
    </style>
</head>

<body>
    <div id="map"></div>

    <script>
        var layer = 'ne:gowalla_totalcheckins';
        var projection_epsg_no = '4326';
        var map = new ol.Map({
            target: 'map',
            view: new ol.View({
                center: [1320666.0673815783, 2210184.8379129963],
                zoom: 2
            }),
            layers: [new ol.layer.VectorTile({
                style: new ol.style.Style({
                    image: new ol.style.Circle({
                        radius: 4,
                        fill: new ol.style.Fill({
                            color: [255, 0, 0, 0.2],
                        }),
                    })
                }),
                source: new ol.source.VectorTile({
                    format: new ol.format.MVT(),
                    url: 'http://localhost:8080/geoserver/gwc/service/tms/1.0.0/' + layer +
                        '@EPSG%3A' + projection_epsg_no + '@pbf/{z}/{x}/{-y}.pbf'
                })
            })]
        });
    </script>
</body>

</html>
复制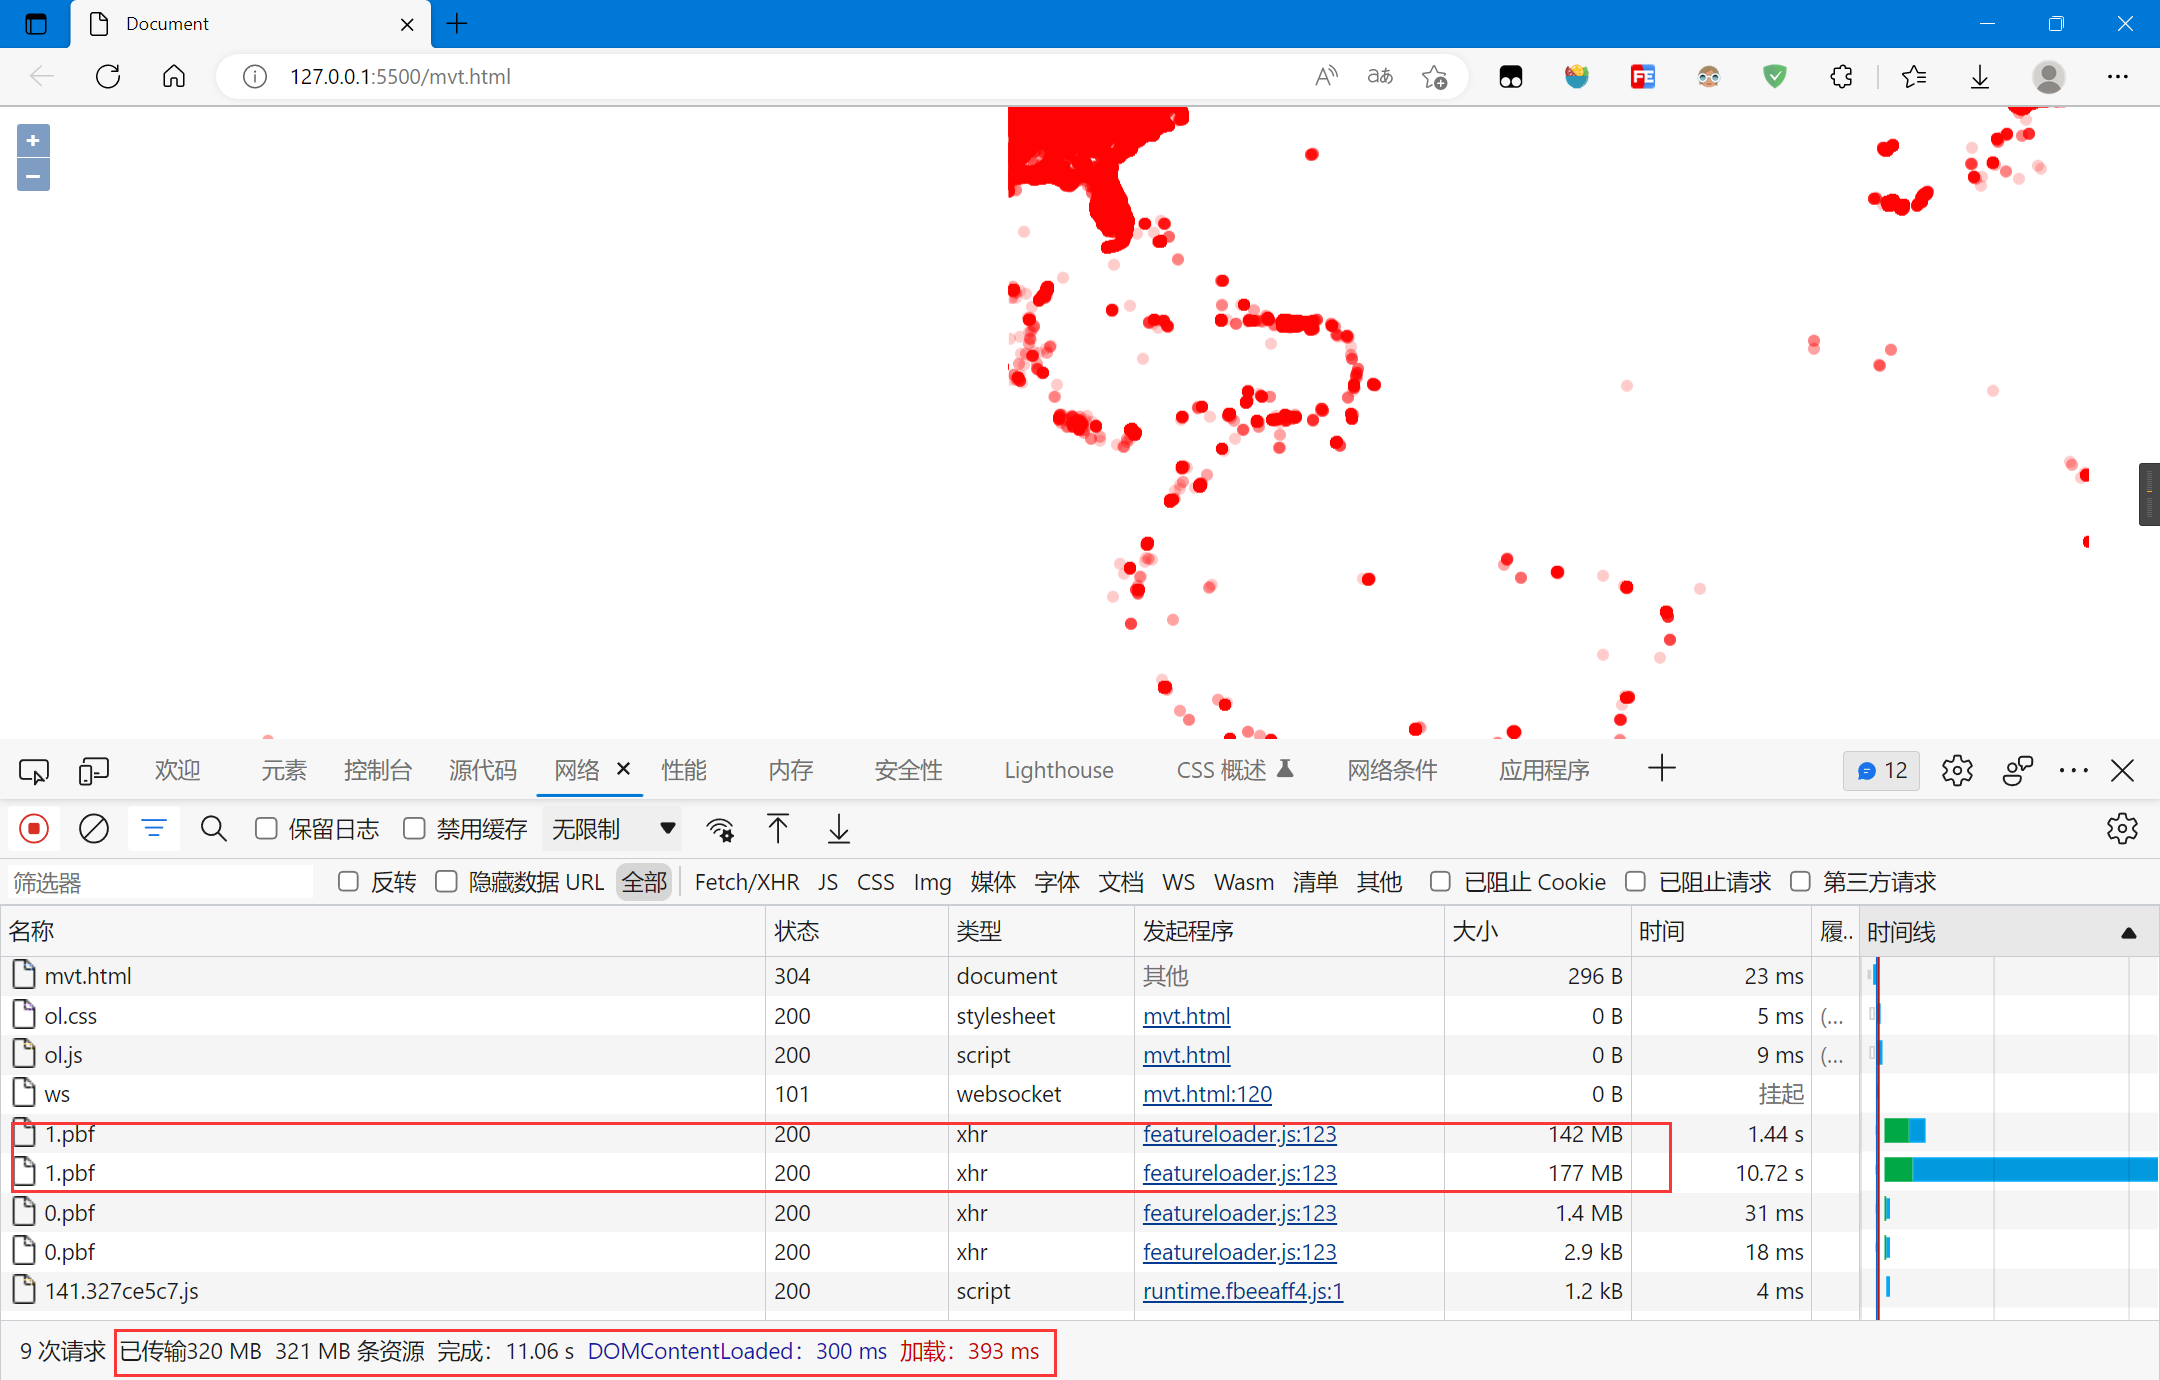
数据多次传输,绘制时间较长,缩放时很卡顿
缩放时会多次请求,在缩放等级小时,数据量很大,网络传输限制,绘制很卡顿
但是,缩放等级大时,局部数据量不大,按需加载,避免一次性传输完成,绘制会很快,下图时缩放等级为12时的页面:
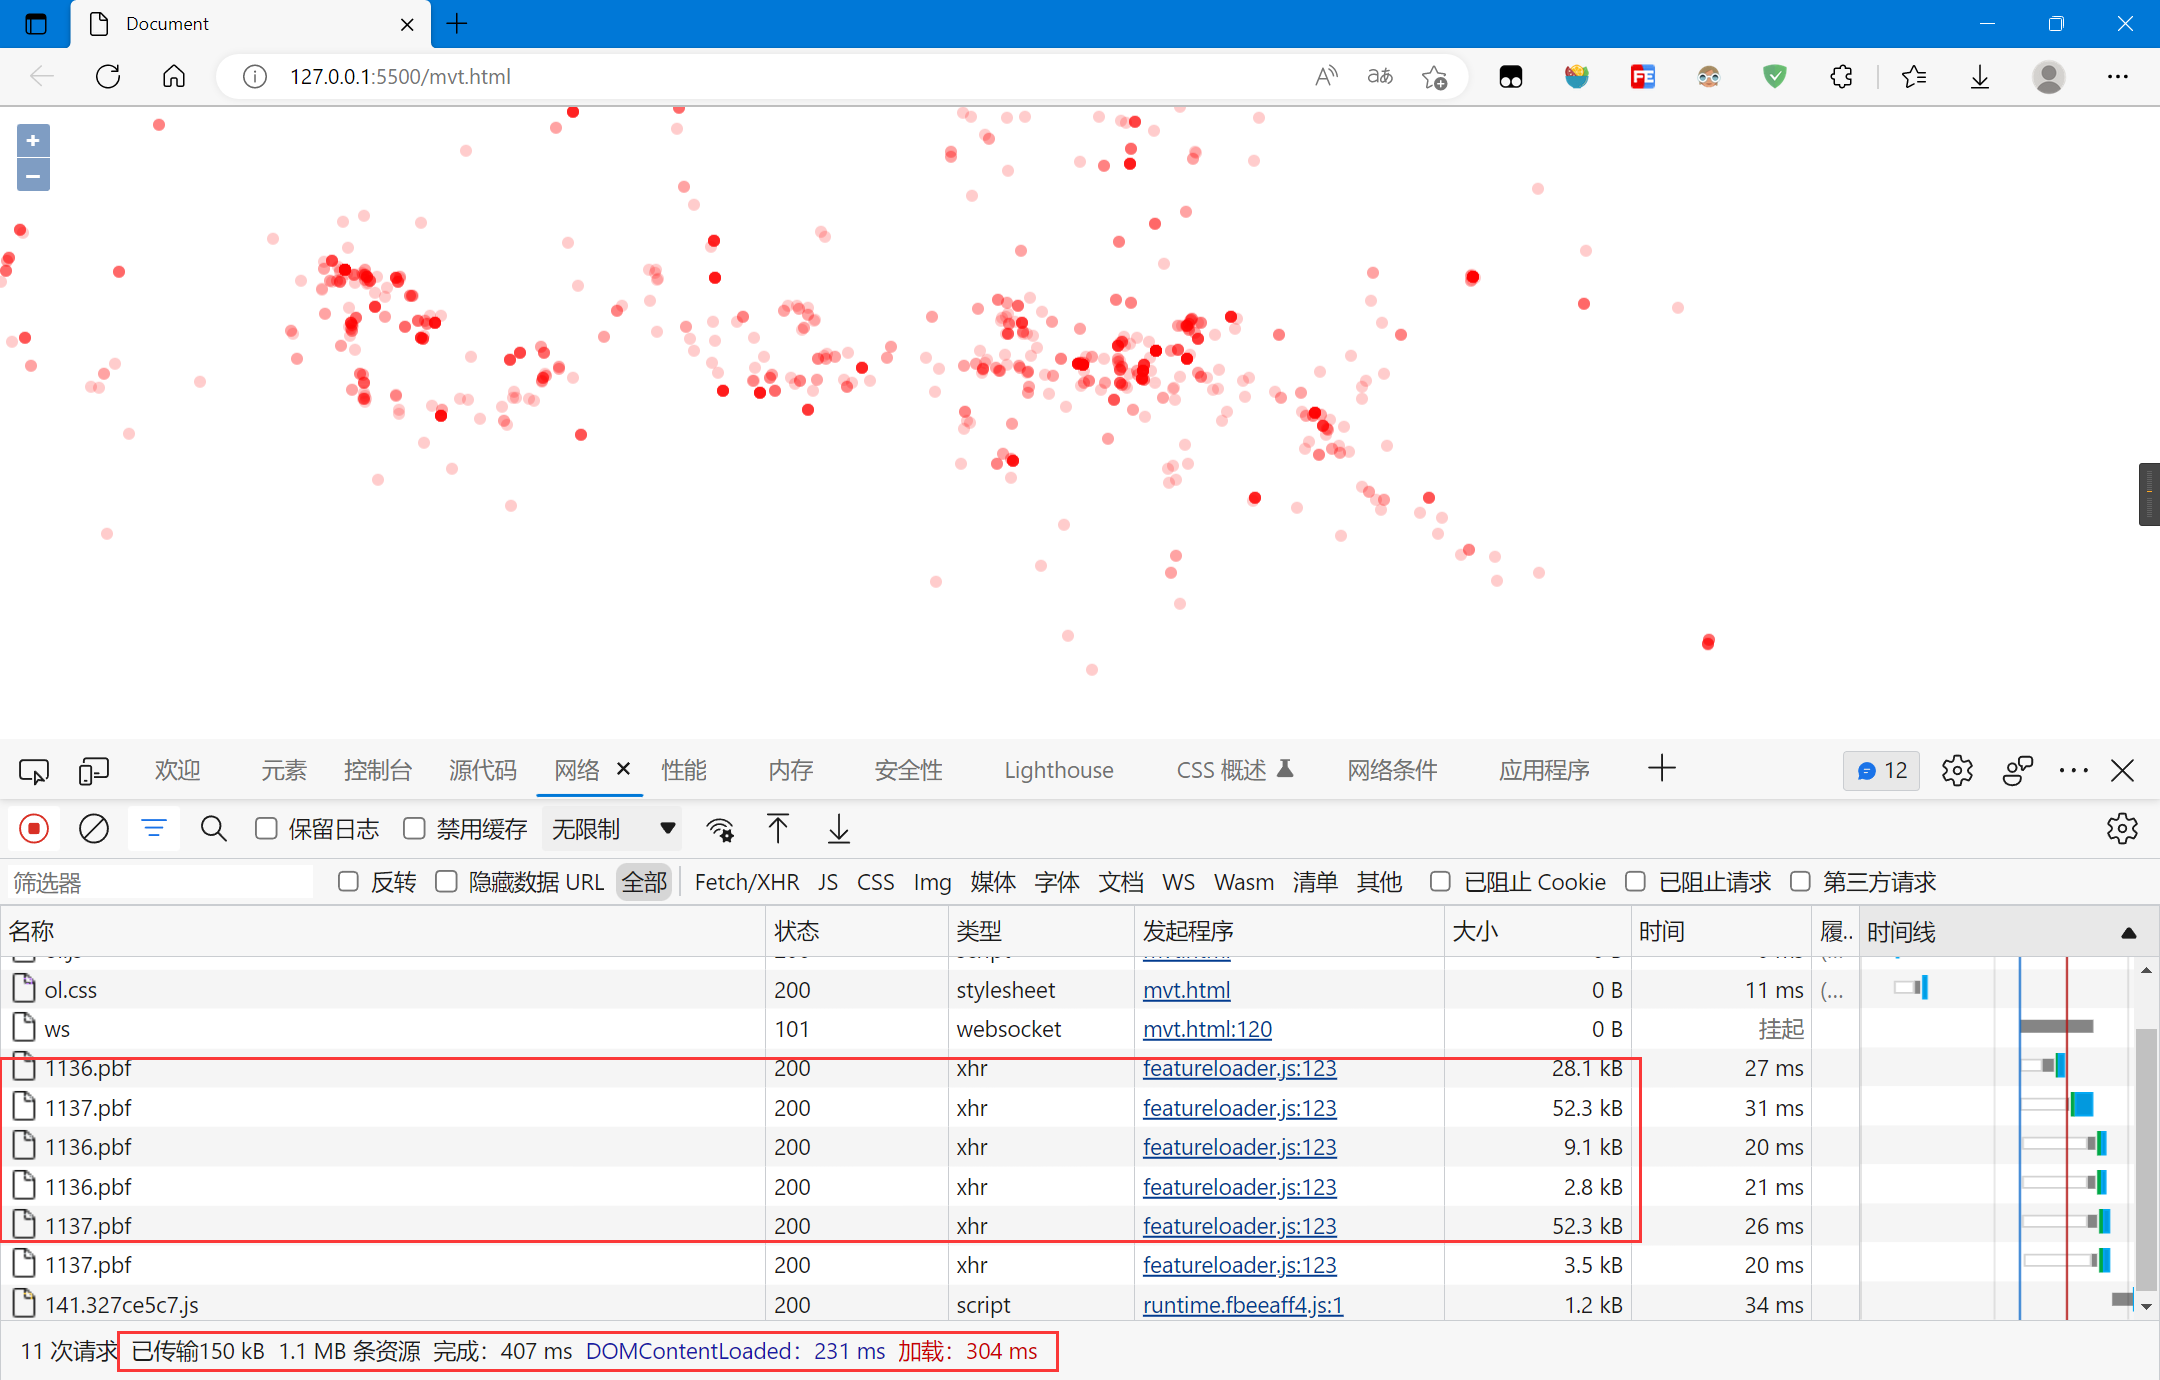
所以,全局数据需要展示时,使用矢量切片并不是一个好的选择,但是展示局部数据时,按需加载的矢量切片是个不错的选择
[1]SNAP: Network datasets: Gowalla (stanford.edu)
[2]csv文件导入到PostGIS(一)_万里归来少年心的博客-CSDN博客
[3]Installing the Vector Tiles Extension — GeoServer 2.23.x User Manual
[4]Vector tiles tutorial — GeoServer 2.23.x User Manual
[5]利用GeoWebCache实现WebGIS地形图展示的缓存优化 - 李晓晖 - 博客园 (cnblogs.com)