
大侠幸会,在下全网同名「算法金」 0 基础转 AI 上岸,多个算法赛 Top 「日更万日,让更多人享受智能乐趣」
在光谱学领域,数据预处理是不可或缺的一环。
本文将基于 NIR soil 近红外光谱数据,运用 Python 语言进行数据处理,并通过图表直观反映预处理带来的变化。(数据集:后台回复 [ NIR soil ] 获取 )
常用的光谱数据预处理技术包括:

import pandas as pd
import numpy as np
import matplotlib.pyplot as plt
from sklearn.preprocessing import StandardScaler

# 读取数据
nirsoil_df = pd.read_csv(path)

# 提取光谱数据
spectra = nirsoil_df.filter(like='spc.')

# 进行MSC预处理
def msc(input_data):
    # 计算参考光谱(均值光谱)
    ref_spectrum = np.mean(input_data, axis=0)
    # 初始化校正后的光谱数据矩阵
    corrected_spectra = np.zeros_like(input_data)

    for i in range(input_data.shape[0]):
        fit = np.polyfit(ref_spectrum, input_data[i, :], 1, full=True)
        corrected_spectra[i, :] = (input_data[i, :] - fit[0][1]) / fit[0][0]

    return corrected_spectra

# 应用MSC
msc_spectra = msc(spectra.values)

# 可视化对比
plt.figure(figsize=(12, 6))

# 原始光谱
plt.subplot(1, 2, 1)
plt.plot(spectra.values.T, color='blue', alpha=0.1)
plt.title('Original Spectra')
plt.xlabel('Wavelength Index')
plt.ylabel('Reflectance')

# MSC校正后的光谱
plt.subplot(1, 2, 2)
plt.plot(msc_spectra.T, color='red', alpha=0.1)
plt.title('MSC Corrected Spectra')
plt.xlabel('Wavelength Index')
plt.ylabel('Reflectance')

plt.tight_layout()
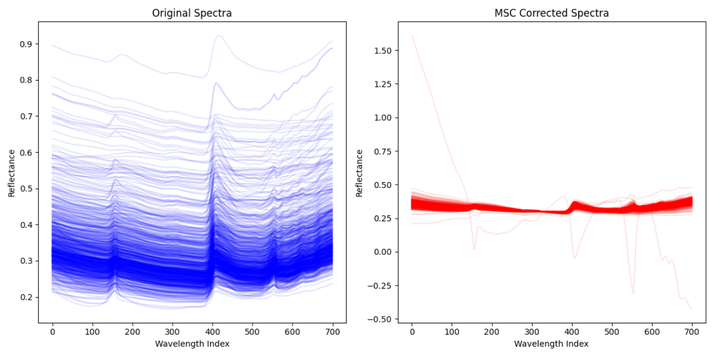
在输出的图片中,左侧显示的是原始光谱数据,右侧显示的是经过MSC(多元散射校正)处理后的光谱数据。
原始光谱(左侧图)
MSC校正后的光谱(右侧图)
总结
防失联,进免费知识星球交流。算法知识直达星球:https://t.zsxq.com/ckSu3
更多内容,见免费知识星球
# 提取光谱数据
spectra = nirsoil_df.filter(like='spc.')

# 进行SNV预处理
def snv(input_data):
    # 每个样本减去其均值,然后除以其标准差
    corrected_spectra = (input_data - np.mean(input_data, axis=1, keepdims=True)) / np.std(input_data, axis=1, keepdims=True)
    return corrected_spectra

# 应用SNV
snv_spectra = snv(spectra.values)

# 可视化对比
plt.figure(figsize=(12, 6))

# 原始光谱
plt.subplot(1, 2, 1)
plt.plot(spectra.values.T, color='blue', alpha=0.1)
plt.title('Original Spectra')
plt.xlabel('Wavelength Index')
plt.ylabel('Reflectance')

# SNV校正后的光谱
plt.subplot(1, 2, 2)
plt.plot(snv_spectra.T, color='green', alpha=0.1)
plt.title('SNV Corrected Spectra')
plt.xlabel('Wavelength Index')
plt.ylabel('Reflectance')

plt.tight_layout()
plt.show()
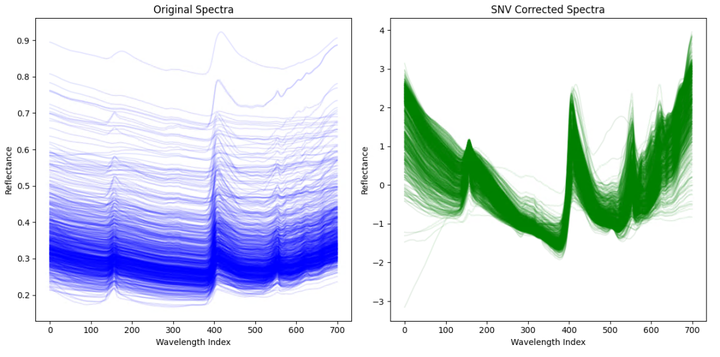
在输出的图片中,左侧显示的是原始光谱数据,右侧显示的是经过SNV(标准正规化变换)处理后的光谱数据。
原始光谱(左侧图)
SNV校正后的光谱(右侧图)
总结

import pandas as pd
import numpy as np
import matplotlib.pyplot as plt

# 读取数据
# nirsoil_df = pd.read_csv('path_to_your_csv.csv')

# 提取光谱数据
spectra = nirsoil_df.filter(like='spc.')

# 进行光谱微分处理
def spectral_derivative(input_data, order=1):
    if order == 1:
        derivative_spectra = np.diff(input_data, n=1, axis=1)
    elif order == 2:
        derivative_spectra = np.diff(input_data, n=2, axis=1)
    else:
        raise ValueError("Only first and second order derivatives are supported.")
    return derivative_spectra

# 一阶微分
first_derivative = spectral_derivative(spectra.values, order=1)

# 二阶微分
second_derivative = spectral_derivative(spectra.values, order=2)

# 可视化对比
plt.figure(figsize=(12, 6))

# 一阶和二阶微分
plt.plot(first_derivative[0, :], label='1st Derivative', color='black')
plt.plot(second_derivative[0, :], label='2nd Derivative', color='red')

plt.title('Spectral Derivatives')
plt.xlabel('Wavelength Index')
plt.ylabel('Reflectance')
plt.legend()
plt.grid(True)
plt.show()
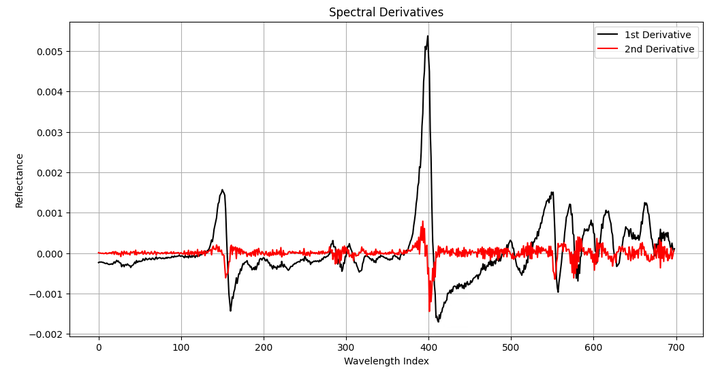
在输出的图片中,我们同时展示了一阶微分和二阶微分处理后的光谱数据。
一阶微分(黑色线)
二阶微分(红色线)
总结
点击 ↑ 领取

import pandas as pd
import numpy as np
import matplotlib.pyplot as plt
from scipy.sparse import diags
from scipy.sparse.linalg import spsolve

# 读取数据
# nirsoil_df = pd.read_csv('path_to_your_csv.csv')

# 提取光谱数据
spectra = nirsoil_df.filter(like='spc.')

# 进行AsLS基线校正
def baseline_als(y, lam=1e5, p=0.01, niter=10):
    L = len(y)
    D = diags([1, -2, 1], [0, -1, -2], shape=(L, L-2))
    D = lam * D.dot(D.T)
    w = np.ones(L)
    for i in range(niter):
        W = diags(w, 0, shape=(L, L))
        Z = W + D
        z = spsolve(Z, w*y)
        w = p * (y > z) + (1-p) * (y < z)
    return z

def baseline_correction(input_data):
    corrected_spectra = np.zeros_like(input_data)
    for i in range(input_data.shape[0]):
        baseline_values = baseline_als(input_data[i, :])
        corrected_spectra[i, :] = input_data[i, :] - baseline_values
    return corrected_spectra

# 应用基线校正
corrected_spectra = baseline_correction(spectra.values)

# 可视化对比
plt.figure(figsize=(12, 6))

# 原始光谱
plt.subplot(1, 2, 1)
plt.plot(spectra.values.T, color='blue', alpha=0.1)
plt.title('Original Spectra')
plt.xlabel('Wavelength Index')
plt.ylabel('Reflectance')

# 基线校正后的光谱
plt.subplot(1, 2, 2)
plt.plot(corrected_spectra.T, color='green', alpha=0.1)
plt.title('Baseline Corrected Spectra')
plt.xlabel('Wavelength Index')
plt.ylabel('Reflectance')

plt.tight_layout()
plt.show()
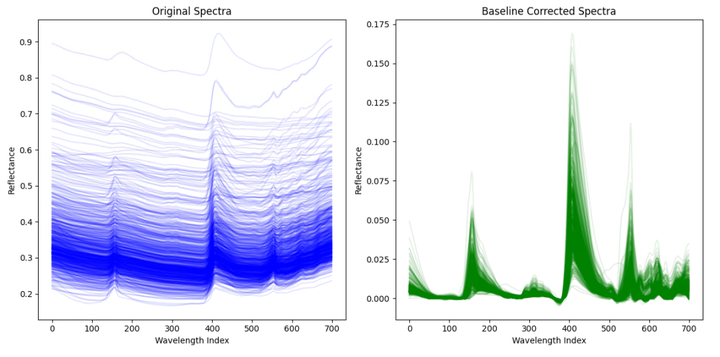
在输出的图片中,左侧显示的是原始光谱数据,右侧显示的是经过基线校正处理后的光谱数据。
原始光谱(左侧图)
基线校正后的光谱(右侧图)
总结
防失联,进免费知识星球交流。算法知识直达星球:https://t.zsxq.com/ckSu3
免费知识星球,欢迎加入交流
import pandas as pd
import numpy as np
import matplotlib.pyplot as plt
from scipy.signal import detrend

# # 读取数据
# nirsoil_df = pd.read_csv('path_to_your_csv.csv')

# 提取光谱数据
spectra = nirsoil_df.filter(like='spc.')

# 进行去趋势处理
def detrending(input_data):
    detrended_spectra = detrend(input_data, axis=1)
    return detrended_spectra

# 应用去趋势处理
detrended_spectra = detrending(spectra.values)

# 可视化对比
plt.figure(figsize=(12, 6))

# 原始光谱
plt.subplot(1, 2, 1)
plt.plot(spectra.values.T, color='blue', alpha=0.1)
plt.title('Original Spectra')
plt.xlabel('Wavelength Index')
plt.ylabel('Reflectance')

# 去趋势后的光谱
plt.subplot(1, 2, 2)
plt.plot(detrended_spectra.T, color='brown', alpha=0.1)
plt.title('Detrended Spectra')
plt.xlabel('Wavelength Index')
plt.ylabel('Reflectance')

plt.tight_layout()
plt.show()
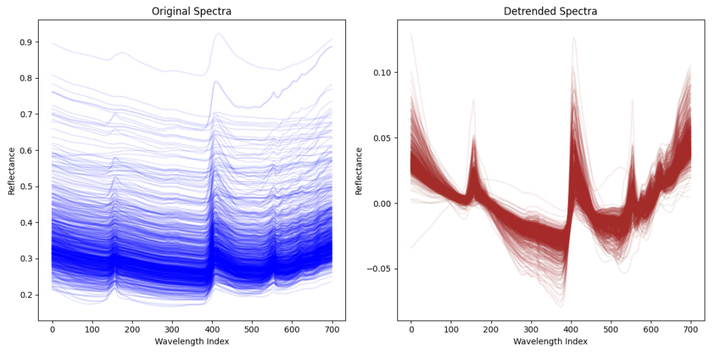
在输出的图片中,左侧显示的是原始光谱数据,右侧显示的是经过去趋势处理后的光谱数据。
原始光谱(左侧图)
去趋势后的光谱(右侧图)
总结
更多内容,见微*公号往期文章: 审稿人:拜托,请把模型时间序列去趋势!!

- 科研为国分忧,创新与民造福 -

日更时间紧任务急,难免有疏漏之处,还请大侠海涵 内容仅供学习交流之用,部分素材来自网络,侵联删
如果觉得内容有价值,烦请大侠多多 分享、在看、点赞,助力算法金又猛又持久、很黄很 BL 的日更下去;
同时邀请大侠 关注、星标 算法金,围观日更万日,助你功力大增、笑傲江湖