本文介绍基于Python中GDAL模块,实现MODIS遥感影像数据的读取、计算,并基于质量控制QC波段进行图像掩膜的方法。
前期的文章Python GDAL读取栅格数据并基于质量评估波段QA对指定数据加以筛选掩膜详细介绍了基于Python语言gdal等模块实现遥感影像栅格数据的读取,以及基于质量评估(QA)波段实现栅格像元筛选与掩膜的全部操作。而在本文,我们依据前述这一篇博客的代码,结合大家更为熟悉的MODIS系列遥感影像产品,基于其质量评估波段进行具体的对照讲解。也就是说,本文重点不在于代码的讲解(具体代码在前述这一篇博客中已经很详细地介绍了),而是将上述代码在更为具体的一个实践中加以应用,告诉大家该如何选择波段、处理质量评估QA波段并进行筛选操作等。同时,这里还有一点需要注意:在MODIS系列遥感影像中,质量评估波段更应该称为质量控制波段,因为其官方手册中将其写作Quality Control,因此后文就写作质量控制波段或QC波段。
首先,需要下载好对应的MODIS数据,大家可以依据文章批量下载MODIS遥感影像:基于LAADS DAAC的方法中的方法进行下载。本文就以一景MODIS的LAI产品——MCD15A3H产品为例进行操作。
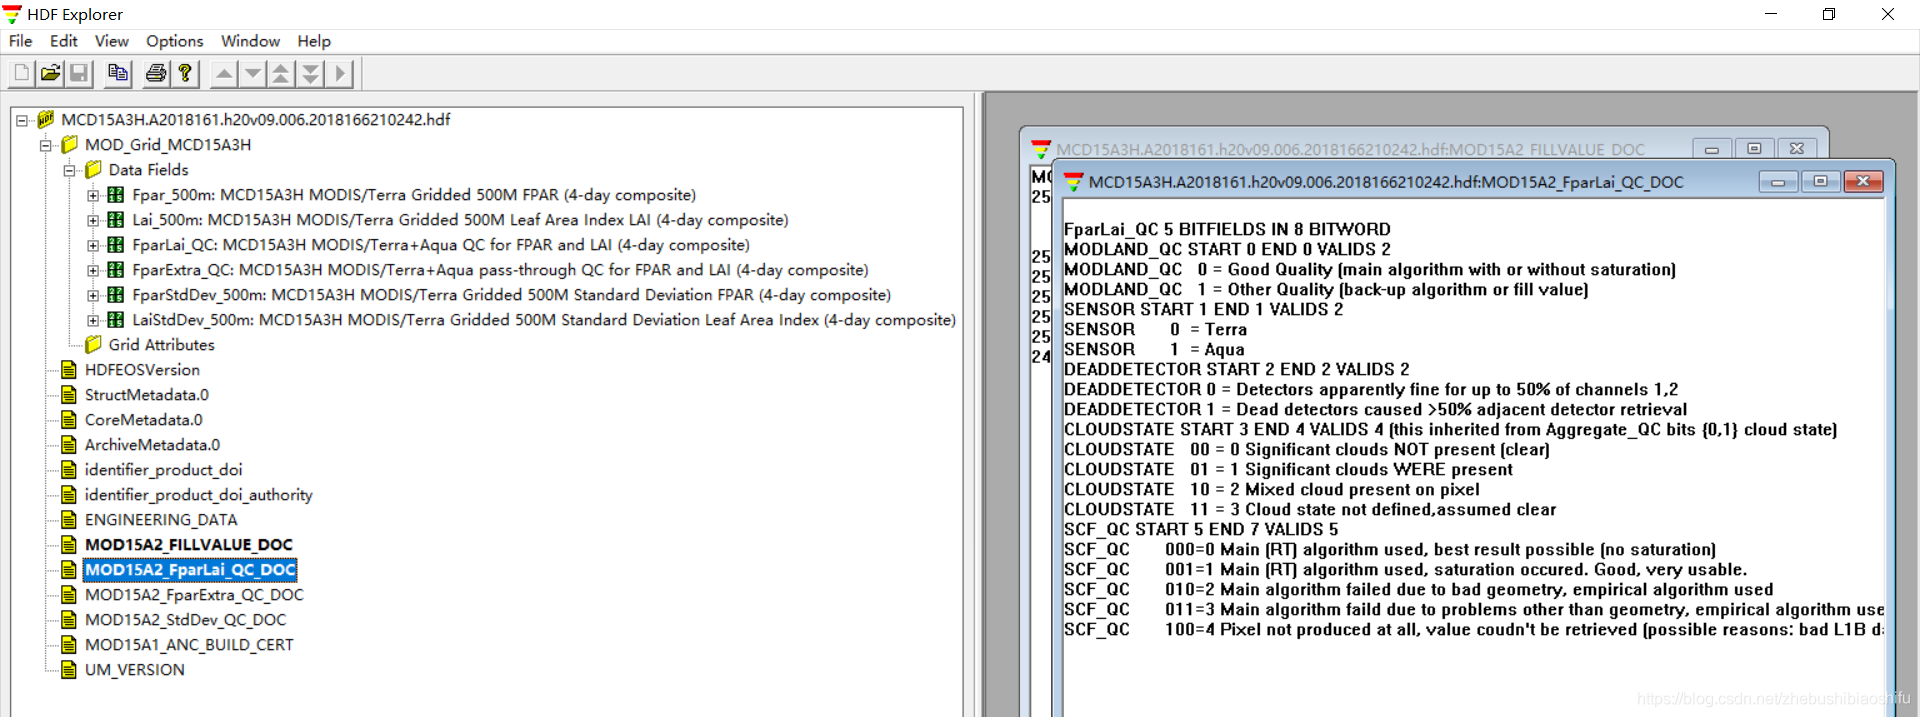
下载后,打开HDF文件可以看到,其具有很多波段,同时包括质量控制QC波段;且在FPAR与LAI波段中,像元数值方面还具有精度较低的像元值、填充值等无效数值。上述这些都需要我们在读取数据时加以识别、处理与筛选。
由于MODIS系列遥感影像产品种类较多,不同产品之间的属性差异较大;因此建议大家每次使用一种MODIS产品时,都到官网查看其基本信息,有需要的话还可以在官网下载对应产品的用户手册。前面提到,本文所用产品为MCD15A3H,因此可以在其官网查阅其基本信息或下载用户手册查看更为详细的产品属性。
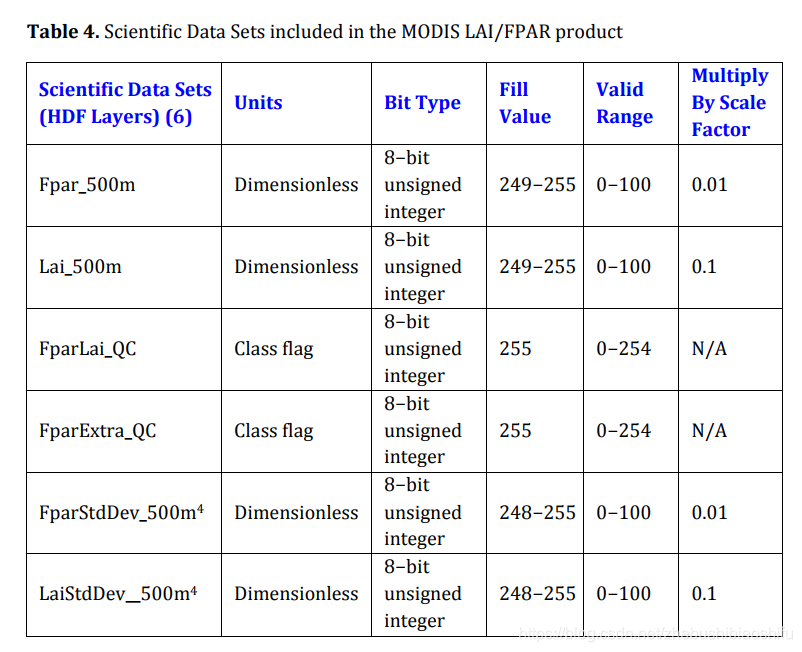
例如,下图所示即为用户手册中关于这一产品一景影像中波段分布情况与每一个波段具体信息的介绍表格;其中包括了波段含义、数据类型、填充值范围、有效值范围与缩放系数等关键参数,这些对于后期我们用gdal读取.hdf格式栅格文件而言具有重要意义。
接下来,质量控制QC波段同样是执行栅格读取操作前有必要了解的信息。下图所示即为用户手册中关于这一产品一景影像中质量控制QC波段具体信息介绍的表格,其中包含了当前一景影像中FPAR与LAI产品的每一个像元所对应的算法、传感器、云覆盖等信息。这里需要注意的是:在MCD15A3H产品中是有2个质量控制QC波段的,这个是第一个QC,而第二个QC主要包括水陆区域、冰雪区域、气溶胶等信息,本文中暂且不涉及第二个QC。
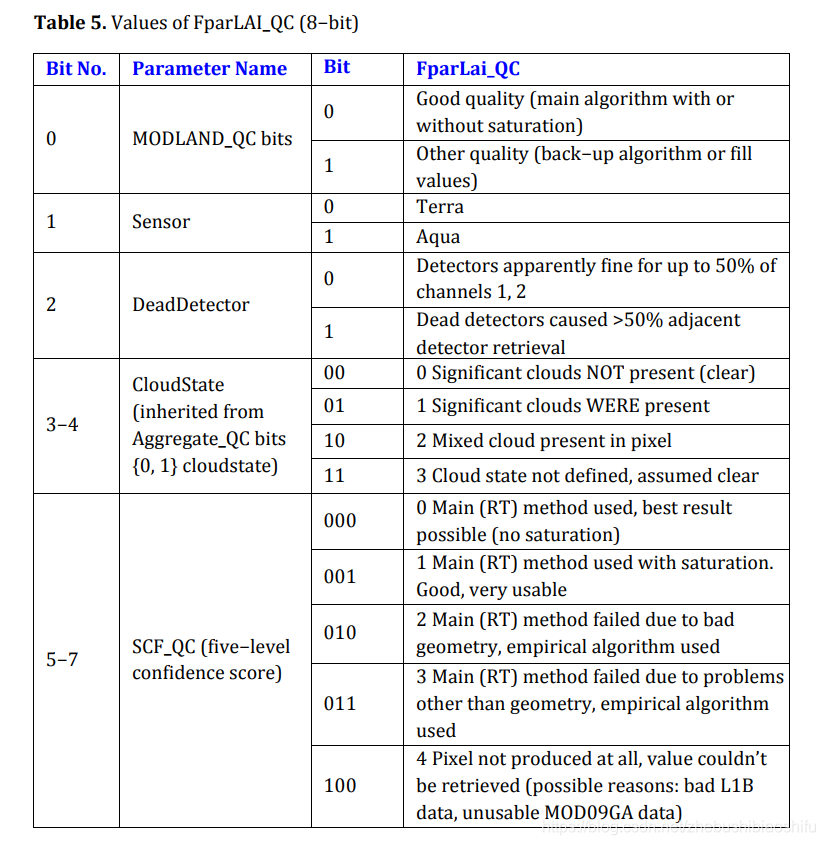
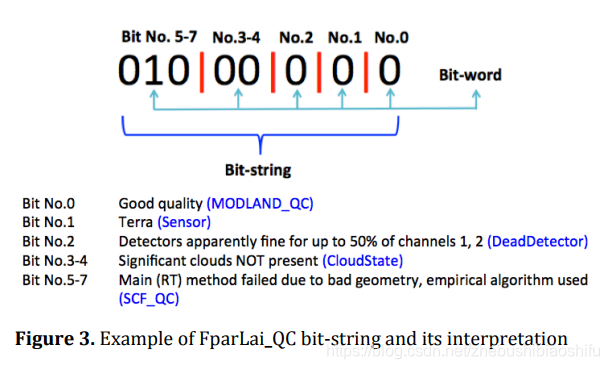
其中,由上表可知,QC波段的信息一共是由0至7共8个比特位(即Bit No.)组成,其中,由若干个比特位又可以组成Bit-word,每一个Bit-word就代表某一种QC波段信息。结合上图,我们可以对照下图这样一个实例进行理解:
结合以上基本信息,我们已经对MCD15A3H产品的基本信息有了一定了解。接下来就可以进行栅格数据的读取与处理、筛选了。
在这里需要注意的是,之前的两篇文章Python GDAL读取栅格数据并基于质量评估波段QA对指定数据加以筛选掩膜以及Python批量读取HDF多波段栅格数据并绘制像元直方图已经对本次所要用到的大部分需求与代码加以实现并进行了详细讲解,这里就不再赘述。本文代码所实现功能与上述第一篇博客中的需求一致,唯一不同的是将GLASS产品更改为了MCD15A3H产品,且仅需对MCD15A3H产品的主算法像元加以做差计算(也就是筛选出MCD15A3H产品中第一个QC波段对应二进制数的第一位为0的像元,其它像元就不用参与差值计算了)。
具体代码如下:
# -*- coding: utf-8 -*-
"""
Created on Sun Jul 25 14:57:45 2021

@author: fkxxgis
"""

import os
import copy
import numpy as np
from osgeo import gdal

rt_file_path="G:/Postgraduate/LAI_Glass_RTlab/Test_DRT/RT_LAI/"
mcd15_file_path="G:/Postgraduate/LAI_Glass_RTlab/Test_DRT/mcd15A3H/"
out_file_path="G:/Postgraduate/LAI_Glass_RTlab/Test_DRT/"

rt_file_list=os.listdir(rt_file_path)
for rt_file in rt_file_list:
    rt_file_split=rt_file.split("_")
    rt_hv=rt_file_split[3][:-4]

    mcd15_file_list=os.listdir(mcd15_file_path)
    for mcd15_file in mcd15_file_list:
        if rt_hv in mcd15_file:
            rt_file_tif_path=rt_file_path+rt_file
            mcd15_file_tif_path=mcd15_file_path+mcd15_file

            drt_out_file_path=out_file_path+"drt/"
            if not os.path.exists(drt_out_file_path):
                os.makedirs(drt_out_file_path)
            drt_out_file_tif_path=drt_out_file_path+rt_hv+".tif"

            eco_out_file_path=out_file_path+"eco/"
            if not os.path.exists(eco_out_file_path):
                os.makedirs(eco_out_file_path)
            eco_out_file_tif_path=eco_out_file_path+rt_hv+".tif"

            wat_out_file_path=out_file_path+"wat/"
            if not os.path.exists(wat_out_file_path):
                os.makedirs(wat_out_file_path)
            wat_out_file_tif_path=wat_out_file_path+rt_hv+".tif"

            tim_out_file_path=out_file_path+"tim/"
            if not os.path.exists(tim_out_file_path):
                os.makedirs(tim_out_file_path)
            tim_out_file_tif_path=tim_out_file_path+rt_hv+".tif"

            rt_raster=gdal.Open(rt_file_tif_path)
            rt_raster_array=rt_raster.ReadAsArray()
            rt_lai_array=rt_raster_array[0]
            rt_qa_array=rt_raster_array[1]
            rt_lai_array_mask=np.where(rt_lai_array>30000,np.nan,rt_lai_array)
            rt_lai_array_fin=rt_lai_array_mask*0.001

            mcd15_raster=gdal.Open(mcd15_file_tif_path)
            mcd15_sub_dataset=mcd15_raster.GetSubDatasets()
            # for sub_dataset in mcd15_sub_dataset:
            #     print(sub_dataset[1])
            # print(mcd15_sub_dataset[1][1])
            # print(mcd15_sub_dataset[2][1])
            mcd15_sub_lai=gdal.Open(mcd15_sub_dataset[1][0])
            mcd15_sub_qc=gdal.Open(mcd15_sub_dataset[2][0])
            mcd15_lai_array=mcd15_sub_lai.ReadAsArray()
            mcd15_qc_array=mcd15_sub_qc.ReadAsArray()
            mcd15_lai_array_mask=np.where(mcd15_lai_array>248,np.nan,mcd15_lai_array)
            mcd15_lai_array_fin=mcd15_lai_array_mask*0.1

            rt_qa_array_bin=copy.copy(rt_qa_array)
            rt_qa_array_row,rt_qa_array_col=rt_qa_array.shape
            for i in range(rt_qa_array_row):
                for j in range(rt_qa_array_col):
                    rt_qa_array_bin[i][j]="{:012b}".format(rt_qa_array_bin[i][j])[-4:]

            mcd15_qc_array_bin=copy.copy(mcd15_qc_array)
            mcd15_qc_array_row,mcd15_qc_array_col=mcd15_qc_array.shape
            for i in range(mcd15_qc_array_row):
                for j in range(mcd15_qc_array_col):
                    mcd15_qc_array_bin[i][j]="{:08b}".format(mcd15_qc_array[i][j])[-1:]

            mcd15_lai_main_array=np.where(mcd15_qc_array_bin==1,np.nan,mcd15_lai_array_fin)

            lai_dif=rt_lai_array_fin-mcd15_lai_main_array
            lai_dif=lai_dif*1000

            drt_lai_dif_array=np.where((rt_qa_array_bin>=100) | (rt_qa_array_bin==11),
                                       np.nan,lai_dif)
            eco_lai_dif_array=np.where((rt_qa_array_bin<100) | (rt_qa_array_bin==111),
                                       np.nan,lai_dif)
            wat_lai_dif_array=np.where((rt_qa_array_bin<1000) | (rt_qa_array_bin==1011),
                                       np.nan,lai_dif)
            tim_lai_dif_array=np.where((rt_qa_array_bin<1100) | (rt_qa_array_bin==1111),
                                       np.nan,lai_dif)

            row=rt_raster.RasterYSize
            col=rt_raster.RasterXSize
            geotransform=rt_raster.GetGeoTransform()
            projection=rt_raster.GetProjection()

            # 输出为int格式后,所得结果中0就是NoData
            driver=gdal.GetDriverByName("Gtiff")
            out_drt_lai=driver.Create(drt_out_file_tif_path,row,col,1,gdal.GDT_Int16)
            out_drt_lai.SetGeoTransform(geotransform)
            out_drt_lai.SetProjection(projection)
            out_drt_lai.GetRasterBand(1).WriteArray(drt_lai_dif_array)
            out_drt_lai=None

            driver=gdal.GetDriverByName("Gtiff")
            out_eco_lai=driver.Create(eco_out_file_tif_path,row,col,1,gdal.GDT_Int16)
            out_eco_lai.SetGeoTransform(geotransform)
            out_eco_lai.SetProjection(projection)
            out_eco_lai.GetRasterBand(1).WriteArray(eco_lai_dif_array)
            out_eco_lai=None

            driver=gdal.GetDriverByName("Gtiff")
            out_wat_lai=driver.Create(wat_out_file_tif_path,row,col,1,gdal.GDT_Int16)
            out_wat_lai.SetGeoTransform(geotransform)
            out_wat_lai.SetProjection(projection)
            out_wat_lai.GetRasterBand(1).WriteArray(wat_lai_dif_array)
            out_wat_lai=None

            driver=gdal.GetDriverByName("Gtiff")
            out_tim_lai=driver.Create(tim_out_file_tif_path,row,col,1,gdal.GDT_Int16)
            out_tim_lai.SetGeoTransform(geotransform)
            out_tim_lai.SetProjection(projection)
            out_tim_lai.GetRasterBand(1).WriteArray(tim_lai_dif_array)
            out_tim_lai=None

            print(rt_hv)
复制
至此,大功告成。