https://www.cnblogs.com/jyi2ya/p/16278495.html复制
环境 Linux Syameimaru-Aya 5.17.0-2-amd64 #1 SMP PREEMPT Debian 5.17.6-1 (2022-05-11) x86_64 GNU/Linux。
Perf 是一个 Linux 下的好用的性能分析工具。
首先安装 linux-perf 软件包,获得 perf(1) 应用程序。
接着运行 perf,发现报了奇怪的错误:
| 19:56 Syameimaru-Aya ~/sr/la/hpc/perf | |
| 0 perf record -a ./a.out | |
| Error: | |
| Access to performance monitoring and observability operations is limited. | |
| Consider adjusting /proc/sys/kernel/perf_event_paranoid setting to open | |
| access to performance monitoring and observability operations for processes | |
| without CAP_PERFMON, CAP_SYS_PTRACE or CAP_SYS_ADMIN Linux capability. | |
| More information can be found at 'Perf events and tool security' document: | |
| https://www.kernel.org/doc/html/latest/admin-guide/perf-security.html | |
| perf_event_paranoid setting is 3: | |
| -1: Allow use of (almost) all events by all users | |
| Ignore mlock limit after perf_event_mlock_kb without CAP_IPC_LOCK | |
| >= 0: Disallow raw and ftrace function tracepoint access | |
| >= 1: Disallow CPU event access | |
| >= 2: Disallow kernel profiling | |
| To make the adjusted perf_event_paranoid setting permanent preserve it | |
| in /etc/sysctl.conf (e.g. kernel.perf_event_paranoid = <setting>) |
跟着报错提示里面提到的文档 Perf events and tool security 看了一圈,大概知道问题出在 perf 的安全措施上。文档里说,随意使用 perf 可能允许人获得其他人正在运行的程序中的数据,不安全。我用的发行版就默认配置成所有人都不能使用 perf 了。
文档给了一种多用户时控制权限,只让特定的人使用 perf 的做法:首先将 /usr/bin/perf 用 setcap(8) 程序加上 CAP_PERFMON CAP_SYS_PTRACE 两个标签,使 /usr/bin/perf 能够正常使用(没有 CAP_PERFMON 标签的应用程序无法调用 perf_event_open(2) 函数)。接着新建个用户组,仅使在那个组里的用户拥有 /usr/bin/perf 的可执行权限。这样对于一个不允许使用 perf 的人来说,外面偷来的 perf 会因为没有 CAP_PERFMON 而无法使用,自带的 /usr/bin/perf 则没有执行权限。整个设置避免了未经许可的人使用 perf 程序。
因为我的笔记本电脑肯定只有我一个用户,所以我非常暴力地改了一发,在 root 权限下往 /proc/sys/kernel/perf_event_paranoid 文件里写了个 -1。接着在 /etc/sysctl.conf 里加入一行 kernel.perf_event_paranoid = -1。
| root@Syameimaru-Aya:~/tmp# echo -1 > /proc/sys/kernel/perf_event_paranoid | |
| root@Syameimaru-Aya:~/tmp# |
接着 perf 就可以正常运行了。
| 20:27 Syameimaru-Aya ~/sr/la/hpc/perf | |
| 0 cat a.c | |
| #include <stdio.h> | |
| int main(void) { | |
| int i; | |
| for (i = 0; i < 10000000; ++i) | |
| i + i; | |
| return 0; | |
| } | |
| 20:27 Syameimaru-Aya ~/sr/la/hpc/perf | |
| 0 gcc -O0 a.c && perf record -a ./a.out | |
| [ perf record: Woken up 1 times to write data ] | |
| [ perf record: Captured and wrote 0.877 MB perf.data (104 samples) ] |
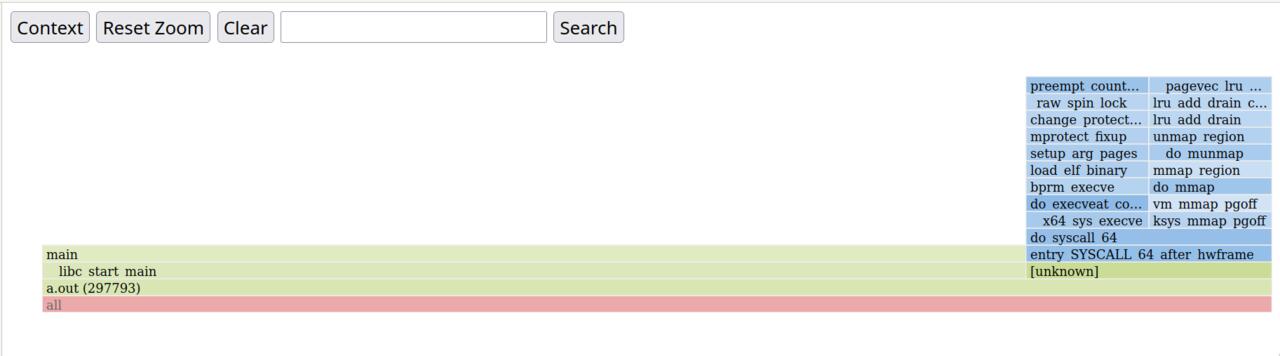
中午午睡的时候梦到生成火焰图要用命令 perf script flamegraph。于是试了一下,发现不行。
| 20:29 Syameimaru-Aya ~/sr/la/hpc/perf | |
| 0 perf script flamegraph | |
| ------------------------------------------------------------ | |
| perf_event_attr: | |
| size 128 | |
| { sample_period, sample_freq } 4000 | |
| ... 超级长的输出 ... | |
| Flame Graph template /usr/share/d3-flame-graph/d3-flamegraph-base.html does not exist. Please install the js-d3-flame-graph (RPM) or libjs-d3-flame-graph (deb) package, specify an existing flame graph template (--template PATH) or another output format (--format FORMAT). |
啊报错说缺少包 libjs-d3-flame-graph。太良心了,连缺什么包都给提示好。显得我很笨的样子 😦。
| 20:33 Syameimaru-Aya ~/sr/la/hpc/perf | |
| 0 i libjs-d3-flame-graph | |
| Reading package lists... Done | |
| Building dependency tree... Done | |
| Reading state information... Done | |
| E: Unable to locate package libjs-d3-flame-graph |
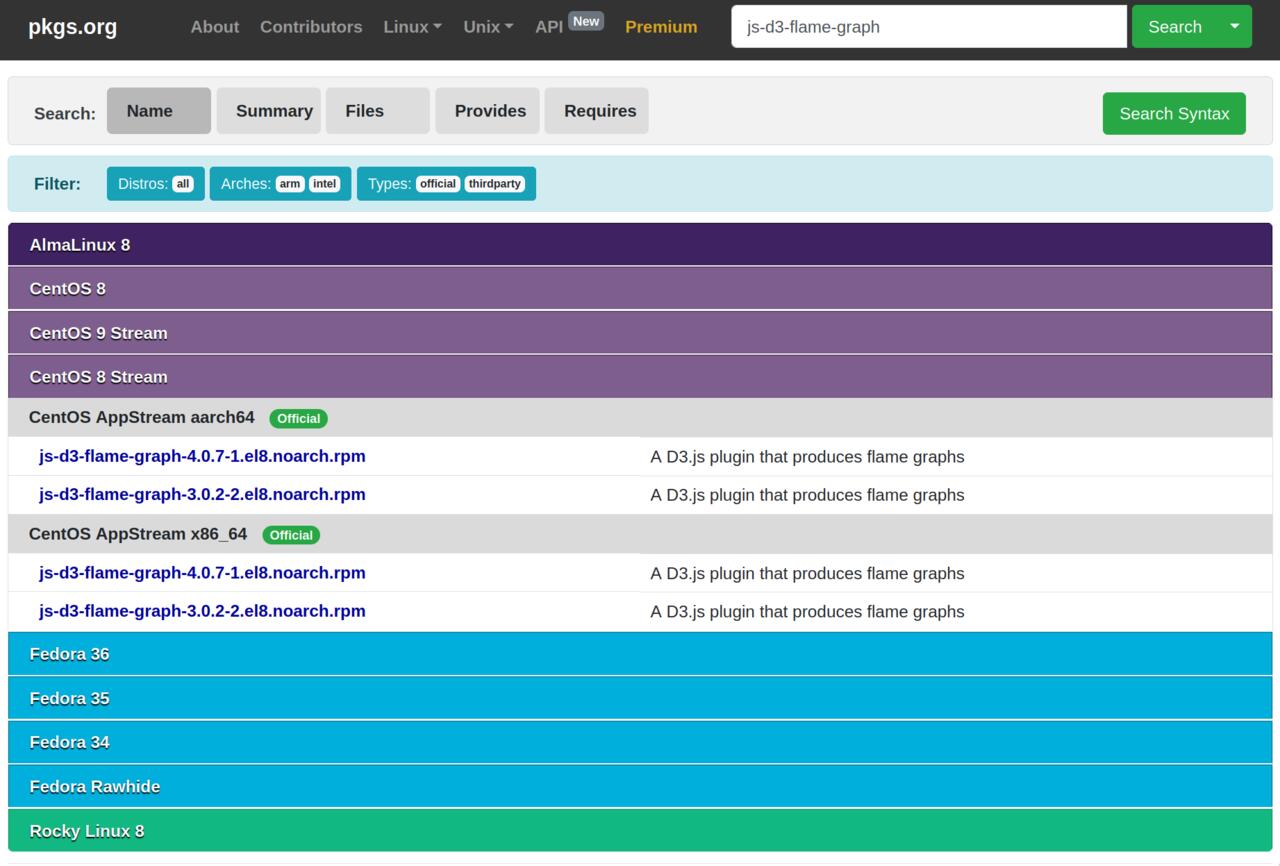
提示说包不存在。用 apt-file 找了下报错信息中提到的关键文件 /usr/share/d3-flame-graph/d3-flamegraph-base.html,发现源里没有这个东西。不过在 pkgs.org 上找了下发现 rpm 的包到是有……怀疑开发都写报错信息的时候只是把红帽系打包的命名习惯改成了 Debian 系的,估计根本就没看有没有这个包吧!
最后用 alien(1p) 把 rpm 转成 deb 装上。成功运行。