The live activity monitoring dashboard and API in NGINX Plus track many system metrics that you can use to analyze the load and performance of your system. If you need request-level information, the access logging in NGINX and NGINX Plus is very flexible – you can configure which data is logged, selecting from the large number of data points that can be included in a log entry in the form of variables. You can also define customized log formats for different parts of your application.
One interesting use case for taking advantage of the flexibility of NGINX access logging is application performance monitoring (APM). There are certainly many APM tools to choose from and NGINX is not a complete replacement for them, but it’s simple to get detailed visibility into the performance of your applications by adding timing values to your code and passing them as response headers for inclusion in the NGINX access log.
In this post we describe how to feed timing data from NGINX or NGINX Plus to Splunk for analysis, but Splunk is just an example – any good log‑analysis tool can provide similar insights.
Using the NGINX Built‑In Timing Variables
NGINX provides a number of built‑in timing variables that you can include in log entries. All are measured in seconds with millisecond resolution.
$request_time– Full request time, starting when NGINX reads the first byte from the client and ending when NGINX sends the last byte of the response body$upstream_connect_time– Time spent establishing a connection with an upstream server$upstream_header_time– Time between establishing a connection to an upstream server and receiving the first byte of the response header$upstream_response_time– Time between establishing a connection to an upstream server and receiving the last byte of the response body
Here is a sample log format called apm that includes these four NGINX timing variables along with some other useful information:
log_format apm '"$time_local" client=$remote_addr '
               'method=$request_method request="$request" '
               'request_length=$request_length '
               'status=$status bytes_sent=$bytes_sent '
               'body_bytes_sent=$body_bytes_sent '
               'referer=$http_referer '
               'user_agent="$http_user_agent" '
               'upstream_addr=$upstream_addr '
               'upstream_status=$upstream_status '
               'request_time=$request_time '
               'upstream_response_time=$upstream_response_time '
               'upstream_connect_time=$upstream_connect_time '
               'upstream_header_time=$upstream_header_time';复制
For example, let’s say that we are getting complaints about slow response times from an application that has three PHP pages – apmtest.php, apmtest2.php, and apmtest3.php – each of which does a database lookup, analyzes some data, and then writes to the database. To determine the source of the slowness, we generate load to our application and analyze the NGINX access log data. For this example, we have NGINX use syslog to send the access log entries to Splunk.
We use the following Splunk command to plot the total request time (corresponding to the $request_time variable) for each PHP page:
* | timechart avg(request_time) by request复制And we get these results (the x‑axis shows requests and the y‑axis shows the response time in seconds):

From this we see that the total request time for each execution of apmtest2.php and apmtest3.php is relatively consistent, but for apmtest.php there are large fluctuations. To take a closer look at that page, we use this Splunk command to plot the upstream response time and upstream connect time for that page only:
* | regex request="(^.+/apmtest.php.+$)" | timechart avg(upstream_response_time) avg(upstream_connect_time)复制And we get these results:
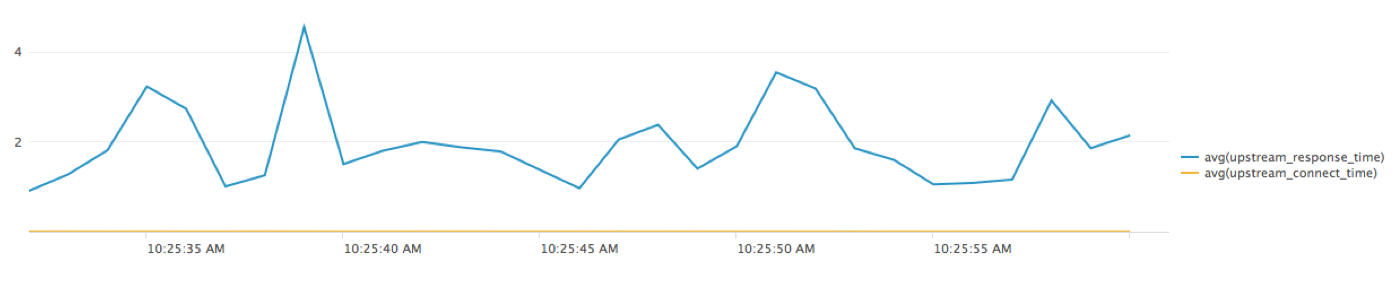
This shows us that the upstream connect time is negligible, so we can focus on the upstream response time as the source of the large and variable total response times.
Using Application‑Defined Timing Values
To drill down, we capture timings in the application itself and include them as response headers, which NGINX then captures in its access log. How granular you want to get is up to you.
To continue with our example, we have the application return the following response headers which record processing time for the indicated internal operations:
db_read_time– Database lookupdb_write_time– Database writeanalysis_time– Data analysisother_time– All other types of processing
NGINX captures the timing values from the response headers by creating corresponding variables, which it names by prepending the string $upstream_http_ to the header name (for example, $upstream_http_db_read_time corresponds to db_read_time). You can then include the variables in log entries just like standard NGINX variables.
Here is the previous sample log format extended to include the application header values:
log_format apm 'timestamp="$time_local" client=$remote_addr '
               'request="$request" request_length=$request_length '
               'bytes_sent=$bytes_sent '
               'body_bytes_sent=$body_bytes_sent '
               'referer=$http_referer '
               'user_agent="$http_user_agent" '
               'upstream_addr=$upstream_addr '
               'upstream_status=$upstream_status '
               'request_time=$request_time '
               'upstream_response_time=$upstream_response_time '
               'upstream_connect_time=$upstream_connect_time '
               'upstream_header_time=$upstream_header_time '
               'app_db_read_time=$upstream_http_db_read_time '
               'app_db_write_time=$upstream_http_db_write_time '
               'app_analysis_time=$upstream_http_analysis_time '
               'app_other_time=$upstream_http_other_time ';复制
Now we run the test again, this time against apmtest.php only. We run the following Splunk command to plot the four application header values:
* | timechart avg(app_db_read_time), avg(app_db_write_time), avg(app_analysis_time), avg(app_other_time)复制And get these results:
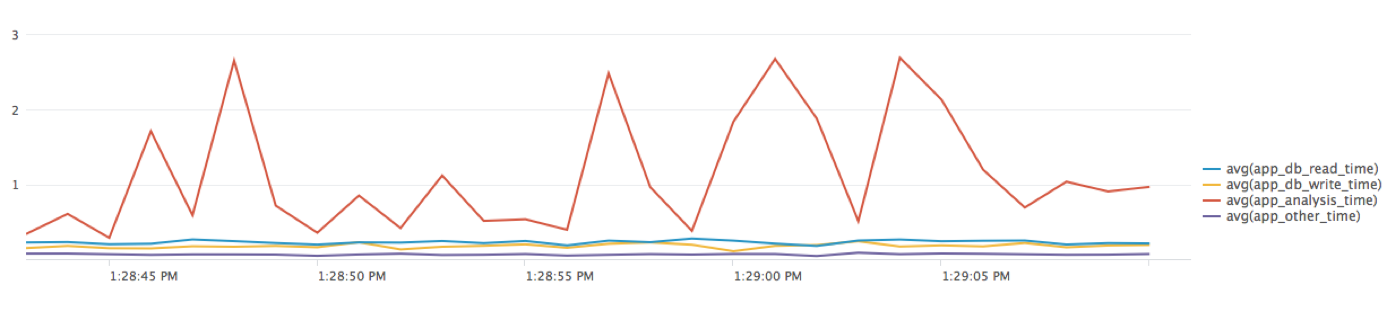
The graph shows that data analysis accounts both for the largest portion of the processing time and for the fluctuations in total response time. To drill down further, we can add additional timings to the code. We can also look through the log details to see whether certain types of requests are causing the longer response times.
Conclusion
While there are many sophisticated APM tools available to help you investigate performance issues with your applications, they are often expensive and complex. You might find that a simple and easy solution like the one described here, using the configurable NGINX access logging capabilities and a log analysis tool, can be quite easy and cost effective. You can use this approach for one‑off troubleshooting, or you can include application‑level timings in the NGINX access log all the time, to help alert you to issues.