1.命令
pgbench --help pgbench is a benchmarking tool for PostgreSQL. Usage: pgbench [OPTION]... [DBNAME] Initialization options: -i, --initialize invokes initialization mode 初始化模式 -F, --fillfactor=NUM set fill factor -n, --no-vacuum do not run VACUUM after initialization -q, --quiet quiet logging (one message each 5 seconds) -s, --scale=NUM scaling factor --foreign-keys create foreign key constraints between tables --index-tablespace=TABLESPACE create indexes in the specified tablespace --tablespace=TABLESPACE create tables in the specified tablespace --unlogged-tables create tables as unlogged tables Options to select what to run: -b, --builtin=NAME[@W] add builtin script NAME weighted at W (default: 1) (use "-b list" to list available scripts) -f, --file=FILENAME[@W] add script FILENAME weighted at W (default: 1) 测试脚本位置(可以自定义) -N, --skip-some-updates skip updates of pgbench_tellers and pgbench_branches (same as "-b simple-update") -S, --select-only perform SELECT-only transactions (same as "-b select-only") Benchmarking options: -c, --client=NUM number of concurrent database clients (default: 1) 模拟客户端个数,相当于并发量 -C, --connect establish new connection for each transaction 设定为每一个事务建一个新连接 -D, --define=VARNAME=VALUE define variable for use by custom script -j, --jobs=NUM number of threads (default: 1) 启动线程数 -l, --log write transaction times to log file -L, --latency-limit=NUM count transactions lasting more than NUM ms as late -M, --protocol=simple|extended|prepared protocol for submitting queries (default: simple) -n, --no-vacuum do not run VACUUM before tests -P, --progress=NUM show thread progress report every NUM seconds 每隔数秒显示线程进度报告 -r, --report-latencies report average latency per command 报告每个命令的平均延迟 -R, --rate=NUM target rate in transactions per second -s, --scale=NUM report this scale factor in output -t, --transactions=NUM number of transactions each client runs (default: 10) -T, --time=NUM duration of benchmark test in seconds 测试时间,单位:秒 -v, --vacuum-all vacuum all four standard tables before tests --aggregate-interval=NUM aggregate data over NUM seconds --progress-timestamp use Unix epoch timestamps for progress --sampling-rate=NUM fraction of transactions to log (e.g., 0.01 for 1%) Common options: -d, --debug print debugging output -h, --host=HOSTNAME database server host or socket directory -p, --port=PORT database server port number -U, --username=USERNAME connect as specified database user -V, --version output version information, then exit -?, --help show this help, then exit复制2.初始化
su - postgres # 使用postgres作为测试库pgbench -i -d postgres # 使用默认参数创造的测试表,各表的数据量:pgbench_accounts:100000pg_branches:1pg_tellers:10复制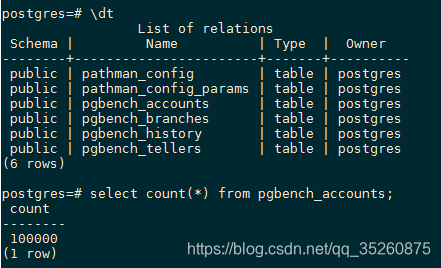
# 设置自定测试数据量,将测试数据扩大100倍,测试总数1000万,并且实时显示创建数据量
pgbench -i -F 100 -s 100 -d postgres复制
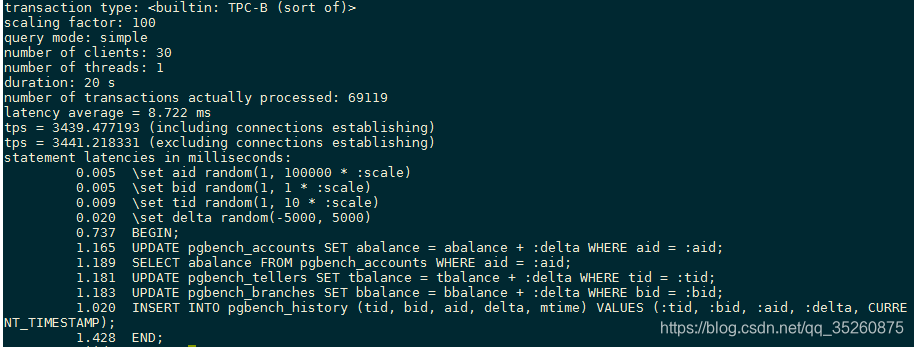
压测结果:
3.压力测试
(1)测试一个客户端session(用户)
# 时间20秒,显示每个命令的平均延迟
pgbench -c 1 -T 20 -r -d postgres复制
(2)测试30个客户端session(用户)
pgbench -c 30 -T 20 -r -d postgres复制
4.自定义脚本压力测试
# 创建测试表
create table test(id int primary key, info text, crt_time timestamp);复制
# 创建脚本
vi test.sql\set id random(1,100000000)insert into test (id,info,crt_time) values (:id, md5(random()::text), now()) on conflict (id) do update set info=excluded.info, crt_time=excluded.crt_time;复制
# 压力测试
pgbench -M prepared -r -f ./test.sql -c 32 -j 32 -T 20 -d postgres复制文章知识点与官方知识档案匹配,可进一步学习相关知识
PostgreSQL技能树首页概览6104 人正在系统学习中