摘要:本文由葡萄城技术团队于博客园原创并首发。转载请注明出处:葡萄城官网,葡萄城为开发者提供专业的开发工具、解决方案和服务,赋能开发者。
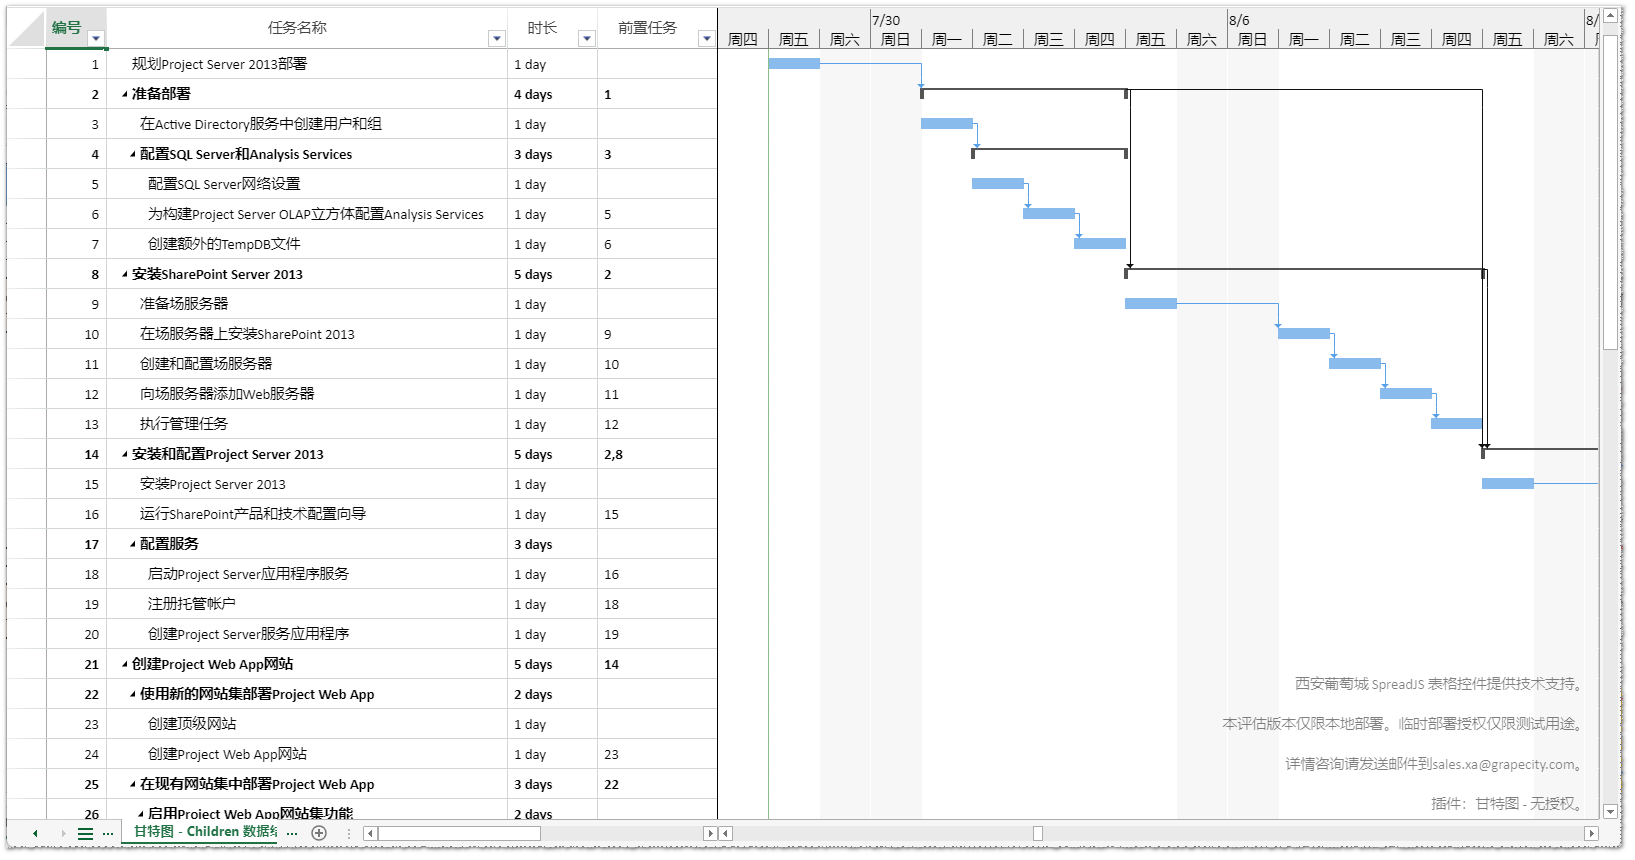
甘特图对于业务场景中的工程项目管理、预算执行、生产计划等都能将原有的表格数据,转变为直观的甘特图模式。作为纯前端表格控件SpreadJS 的插件,甘特图可以作为一个特殊的“Sheet”融入已有的表格中,方便进行数据的可视化展示,也能更直观的查看计划执行情况,如下图所示:

SpreadJS甘特图插件具备以下的功能:
1. 基于 SpreadJS 的底层数据模型,能够将树形数据展示为甘特图表格和图表,支持 ID、Level、Children类型数据结构
// the id-parentId structure

schema: {

hierarchy: {

type: "Parent",

column: "parentId"

},

columns: {

id: { isPrimaryKey: true }, // the primary key is required in Id-ParentId type, so that we could build the hierarchy tree nodes

taskNumber: { dataType: "rowOrder" } // the row order is required in Id-ParentId type, to make sure the you could update the correct data

}

}

// the level structure

schema: {

hierarchy: {

type: "Level",

column: "level"

}

}

// the children tree structure

schema: {

hierarchy: {

type: "ChildrenPath",

column: "children"

}

}
复制
2. 支持对图表区域进行缩放

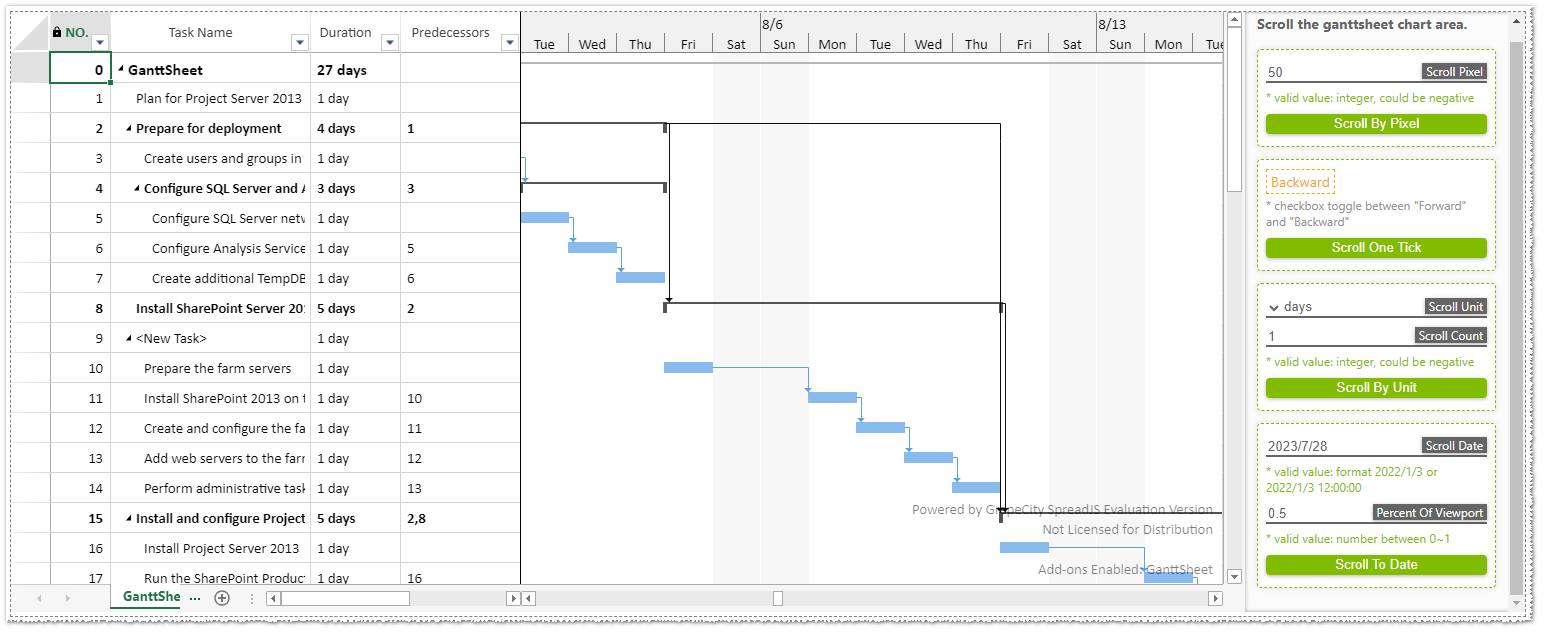
3. 支持按照不同单位进行滚动

4. 可对图表中的对象进行定制

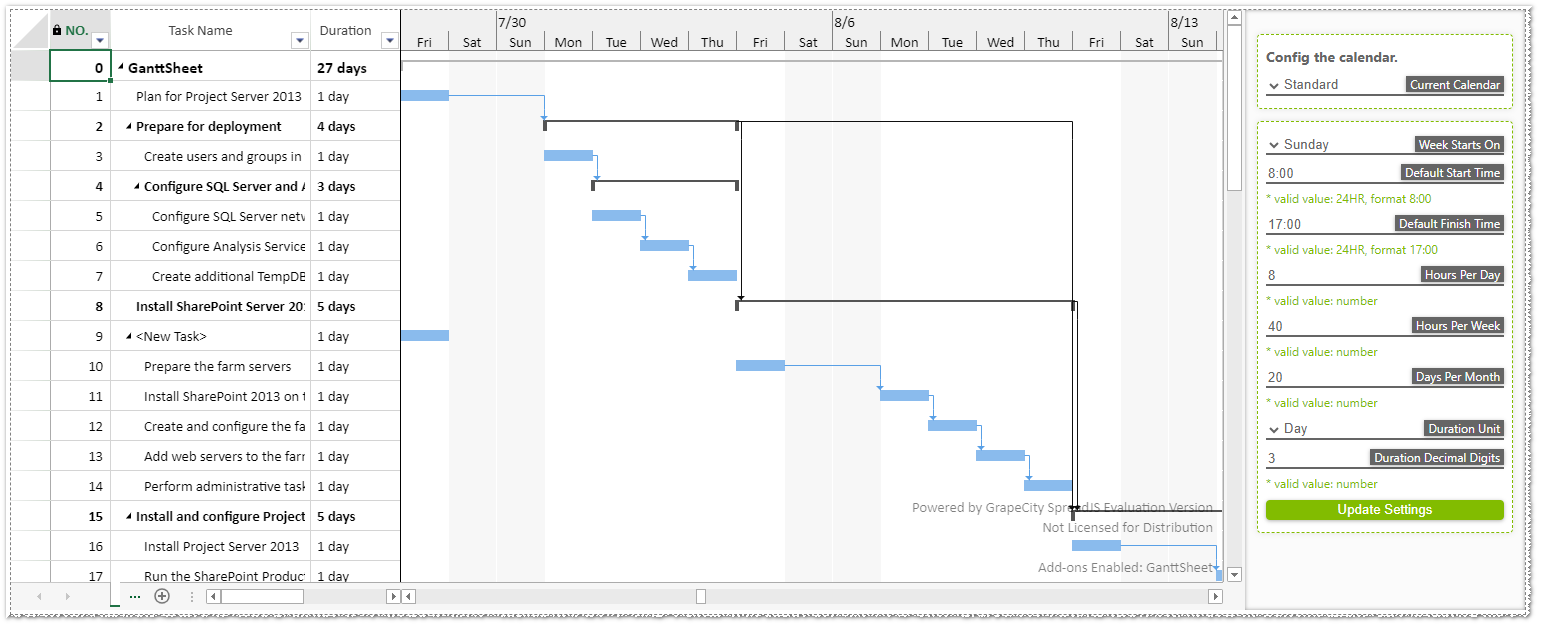
5. 可对日历进行配置

6. 支持保存为 SSJSON / SJS / Excel / PDF,并支持打印功能

如果想参与甘特图的预览版试用,可访问以下地址进行获取:https://gcdn.grapecity.com.cn/showtopic-180313-1-1.html
预览版产品包有以下的内容:
扩展链接: