最近看了一个虚机的CPU使用情况,使用mpstat -P ALL命令查看系统的CPU情况(该系统只有一个CPU core),发现该CPU的%usr长期维持在70%左右,且%sys也长期维持在20%左右:
03:56:29 AM CPU %usr %nice %sys %iowait %irq %soft %steal %guest %gnice %idle 03:56:34 AM all 67.11 0.00 24.83 0.00 0.00 8.05 0.00 0.00 0.00 0.00 03:56:34 AM 0 67.11 0.00 24.83 0.00 0.00 8.05 0.00 0.00 0.00 0.00复制
mpstat命令展示的CPU结果和top命令一致
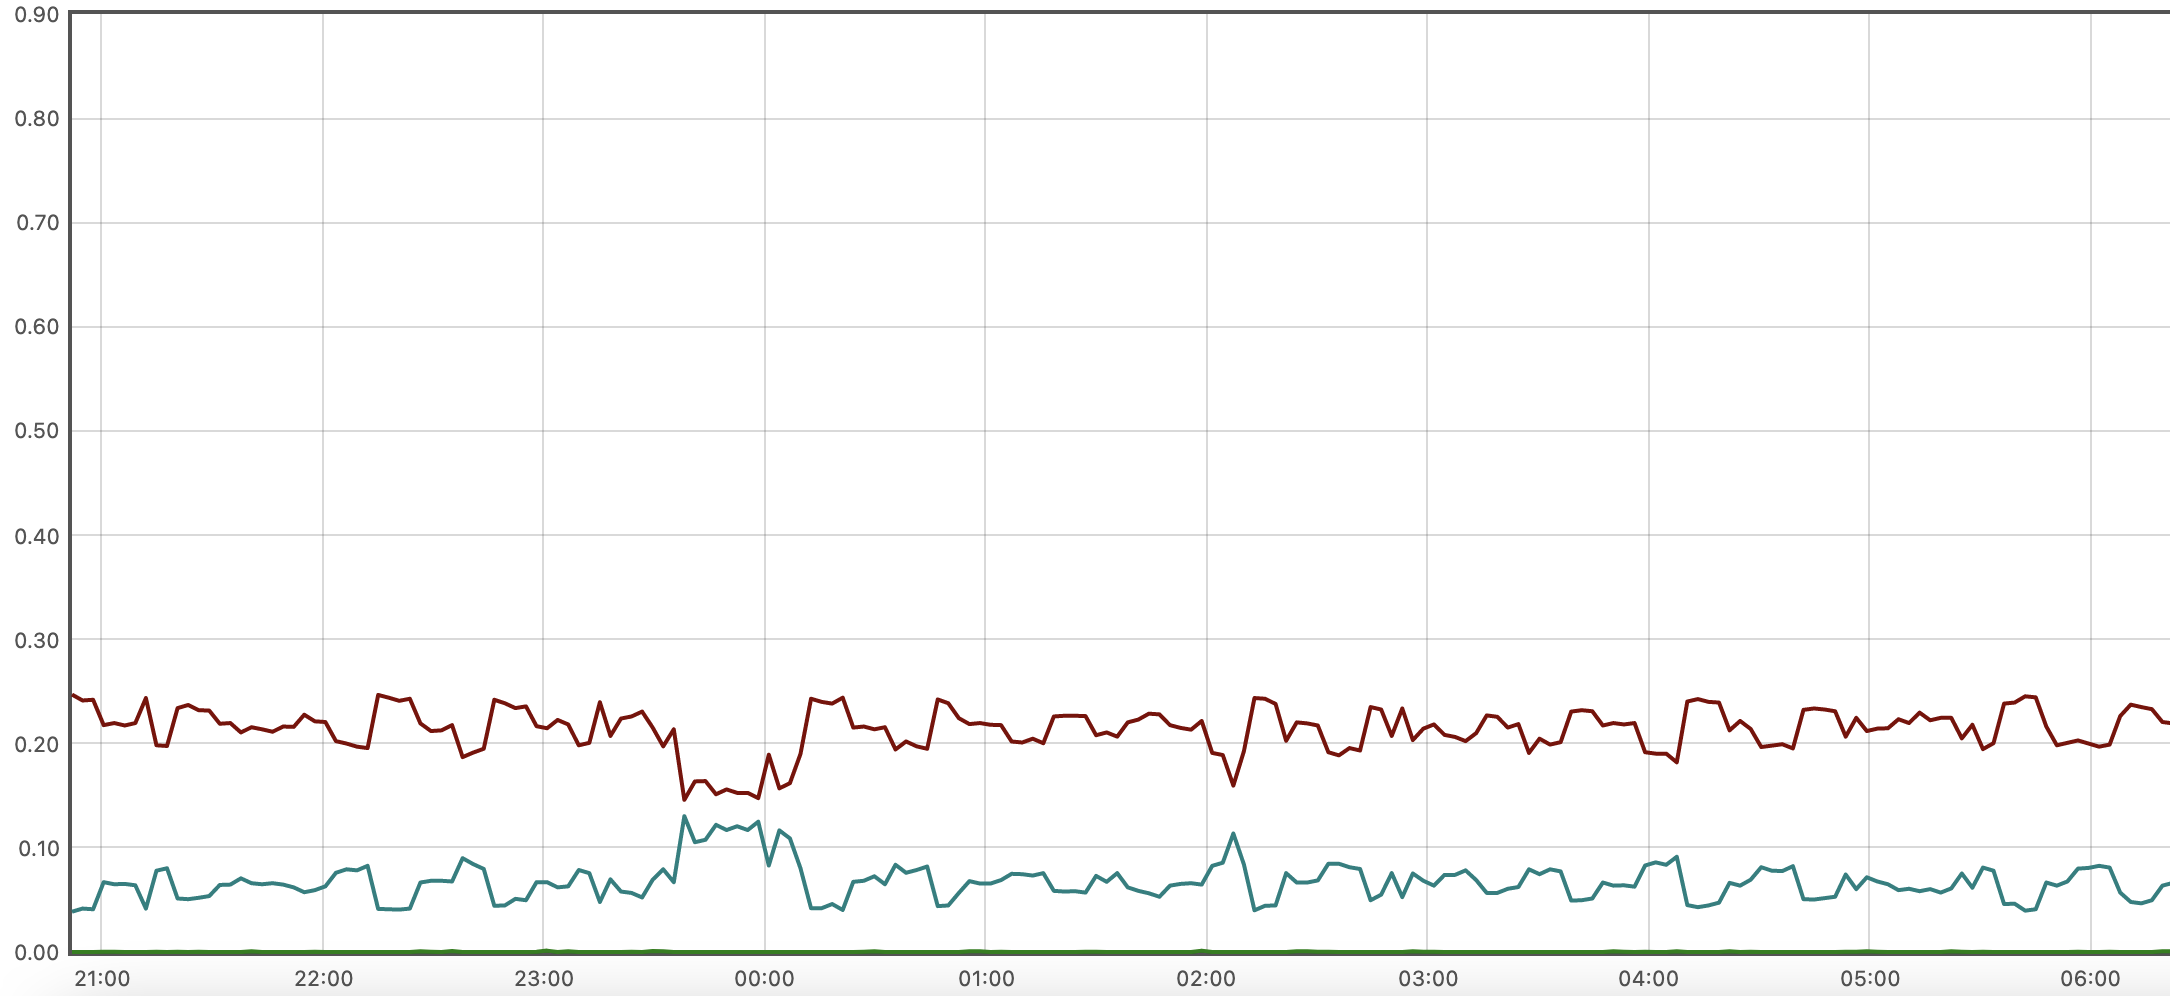
但通过Grafana查看发现该机器的%usr和%sys均低于实际情况。如下图棕色曲线为usr,蓝色曲线为sys:

Grafana 的表达式如下:
avg by (mode, instance) (irate(node_cpu_seconds_total{instance=~"$instance", mode=~"user|system|iowait"}[$__rate_interval]))
复制一开始怀疑是node-exporter版本问题,但查看node-exporter的release notes并没有相关bug,在切换为最新版本之后,问题也没有解决。
大部分与系统相关的prometheus指标都是直接从系统指标文件中读取并转换过来的。node-exporter中与CPU相关的指标就读取自/proc/stat,其中与CPU相关的内容就是下面的前两行,每行十列数据,分别表示User、Nice、System、Idle、Iowait、IRQ SoftIRQ、Steal、 Guest 、GuestNice
# cat /proc/stat
cpu  18651720 282843 9512262 493780943 10294540 0 2239778 0 0 0
cpu0 18651720 282843 9512262 493780943 10294540 0 2239778 0 0 0
intr 227141952 99160476 9 0 0 2772 0 0 0 0 0 0 0 157 0 0 0 0 0 0 0 0 0 0 0 0 0 0 0 0 0 0 0 0 0 0 0 0 0 0 0 0 0 0 0 0 0 0 0 0 0 0 0 0 0 0 0 0 0 0 0 0 0 0 0 0 0 0 0 0 0 0 0 0 0 0 0 0 0 0 0 0 0 0 0 0 0 0 0 0 0 0 0 0 0 0 0 0 0 0 0 0 0 0 0 0 0 0 0 0 0 0 0 0 0 0 0 0 0 0 0 0 0 0 0 0 0 0 0 0 0 0 0 0 0 0 0 0 0 0 0 0 0 0 0 0 0 0 0 0 0 0 0 0 0 0 0 0 0 0 0 0 0 0 0 0 0 0 0 0 0 0 0 0 0 0 0 0 0 0 0 0 0 0 0 0 0 0 0 0 0 0 0 0 0 0 0 0 0 0 0 0 0 0 0 0 0 0 0 0 0 0 0 0 0 0 0 0 0 0 0 0 0 0 0 0 0 0 0 0 0 0 0 0 0 0 0 0 0 0 0 0 0 0 0 0 0 0 0 0 0 0 0 0 0 0 0
ctxt 4027171429
btime 1671775036
processes 14260129
procs_running 5
procs_blocked 0
softirq 1727699538 0 816653671 1 233469155 45823320 0 52888978 0 0 578864413
复制node-exporter并没有做什么运算,它只是将这十列数据除以userHZ(100),打上mode标签之后转换为prometheus格式的指标:
node_cpu_seconds_total{cpu="0", instance="redis:9100", mode="user"}                                    244328.77
复制那mpstat是如何计算不同mode的CPU利用率呢?
在mpstat的源代码中可以看到,mode为User的计算方式如下,涉及三个参数:
scc: 当前采样到的CPU信息,对应/proc/stat中的CPU信息scp: 上一次采样到的CPU信息,对应/proc/stat中的CPU信息deltot_jiffies: 两次CPU采样之间的jiffies(下面介绍什么是jiffies)ll_sp_value(scp->cpu_user - scp->cpu_guest, scc->cpu_user - scc->cpu_guest, deltot_jiffies)复制
ll_sp_value函数的定义如下,它使用了宏定义SP_VALUE:
/*
 ***************************************************************************
 * Workaround for CPU counters read from /proc/stat: Dyn-tick kernels
 * have a race issue that can make those counters go backward.
 ***************************************************************************
 */
double ll_sp_value(unsigned long long value1, unsigned long long value2,
		   unsigned long long itv)
{
	if (value2 < value1)
		return (double) 0;
	else
		return SP_VALUE(value1, value2, itv);
}
复制SP_VALUE的定义如下:
/* With S_VALUE macro, the interval of time (@p) is given in 1/100th of a second */
#define S_VALUE(m,n,p)		(((double) ((n) - (m))) / (p) * 100)
/* Define SP_VALUE() to normalize to % */
#define SP_VALUE(m,n,p)		(((double) ((n) - (m))) / (p) * 100)
/*
复制根据SP_VALUE定义可以看到两次CPU采样获取到的mode为User的CPU占用率计算方式为:(((double) ((scp->cpu_user - scp->cpu_guest) - (scp->cpu_user - scp->cpu_guest))) / (deltot_jiffies) * 100)
下面函数用于计算deltot_jiffies,可以看到jiffies其实就是/proc/stat中的CPU数值单位:
/*
 ***************************************************************************
 * Since ticks may vary slightly from CPU to CPU, we'll want
 * to recalculate itv based on this CPU's tick count, rather
 * than that reported by the "cpu" line. Otherwise we
 * occasionally end up with slightly skewed figures, with
 * the skew being greater as the time interval grows shorter.
 *
 * IN:
 * @scc	Current sample statistics for current CPU.
 * @scp	Previous sample statistics for current CPU.
 *
 * RETURNS:
 * Interval of time based on current CPU, expressed in jiffies.
 *
 * USED BY:
 * sar, sadf, mpstat
 ***************************************************************************
 */
unsigned long long get_per_cpu_interval(struct stats_cpu *scc,
					struct stats_cpu *scp)
{
	unsigned long long ishift = 0LL;

	if ((scc->cpu_user - scc->cpu_guest) < (scp->cpu_user - scp->cpu_guest)) {
		/*
		 * Sometimes the nr of jiffies spent in guest mode given by the guest
		 * counter in /proc/stat is slightly higher than that included in
		 * the user counter. Update the interval value accordingly.
		 */
		ishift += (scp->cpu_user - scp->cpu_guest) -
		          (scc->cpu_user - scc->cpu_guest);
	}
	if ((scc->cpu_nice - scc->cpu_guest_nice) < (scp->cpu_nice - scp->cpu_guest_nice)) {
		/*
		 * Idem for nr of jiffies spent in guest_nice mode.
		 */
		ishift += (scp->cpu_nice - scp->cpu_guest_nice) -
		          (scc->cpu_nice - scc->cpu_guest_nice);
	}

	/*
	 * Workaround for CPU coming back online: With recent kernels
	 * some fields (user, nice, system) restart from their previous value,
	 * whereas others (idle, iowait) restart from zero.
	 * For the latter we need to set their previous value to zero to
	 * avoid getting an interval value < 0.
	 * (I don't know how the other fields like hardirq, steal... behave).
	 * Don't assume the CPU has come back from offline state if previous
	 * value was greater than ULLONG_MAX - 0x7ffff (the counter probably
	 * overflew).
	 */
	if ((scc->cpu_iowait < scp->cpu_iowait) && (scp->cpu_iowait < (ULLONG_MAX - 0x7ffff))) {
		/*
		 * The iowait value reported by the kernel can also decrement as
		 * a result of inaccurate iowait tracking. Waiting on IO can be
		 * first accounted as iowait but then instead as idle.
		 * Therefore if the idle value during the same period did not
		 * decrease then consider this is a problem with the iowait
		 * reporting and correct the previous value according to the new
		 * reading. Otherwise, treat this as CPU coming back online.
		 */
		if ((scc->cpu_idle > scp->cpu_idle) || (scp->cpu_idle >= (ULLONG_MAX - 0x7ffff))) {
			scp->cpu_iowait = scc->cpu_iowait;
		}
		else {
			scp->cpu_iowait = 0;
		}
	}
	if ((scc->cpu_idle < scp->cpu_idle) && (scp->cpu_idle < (ULLONG_MAX - 0x7ffff))) {
		scp->cpu_idle = 0;
	}

	/*
	 * Don't take cpu_guest and cpu_guest_nice into account
	 * because cpu_user and cpu_nice already include them.
	 */
	return ((scc->cpu_user    + scc->cpu_nice   +
		 scc->cpu_sys     + scc->cpu_iowait +
		 scc->cpu_idle    + scc->cpu_steal  +
		 scc->cpu_hardirq + scc->cpu_softirq) -
		(scp->cpu_user    + scp->cpu_nice   +
		 scp->cpu_sys     + scp->cpu_iowait +
		 scp->cpu_idle    + scp->cpu_steal  +
		 scp->cpu_hardirq + scp->cpu_softirq) +
		 ishift);
}
复制从上面计算方式可以看到,deltot_jiffies近似可以认为是两次CPU采样的所有mode总和之差,以下表为例:
User Nice System Idle Iowait IRQ SoftIRQ Steal Guest GuestNice cpu 18424040 281581 9443941 493688502 10284789 0 2221013 0 0 0 # 第一次采样,作为scp cpu 18424137 281581 9443954 493688502 10284789 0 2221020 0 0 0 # 第二次采样,作为scc复制
deltot_jiffies的计算方式为:
(18424137+281581+9443954+493688502+10284789) - (18424040+281581+9443941+493688502+2221013) + 0 = 117
复制那么根据采样到的数据,可以得出当前虚拟机上的mode为User的CPU占用率为:(((double) ((18424137 - 0) - (18424040 - 0))) / (117) * 100)=82.9%,与预期相符。
再回头看下出问题的Grafana表达式,可以看出其计算的是mode为User的CPU的变动趋势,而不是CPU占用率,按照mpstat的计算方式,该mode的占用率的近似计算方式如下:
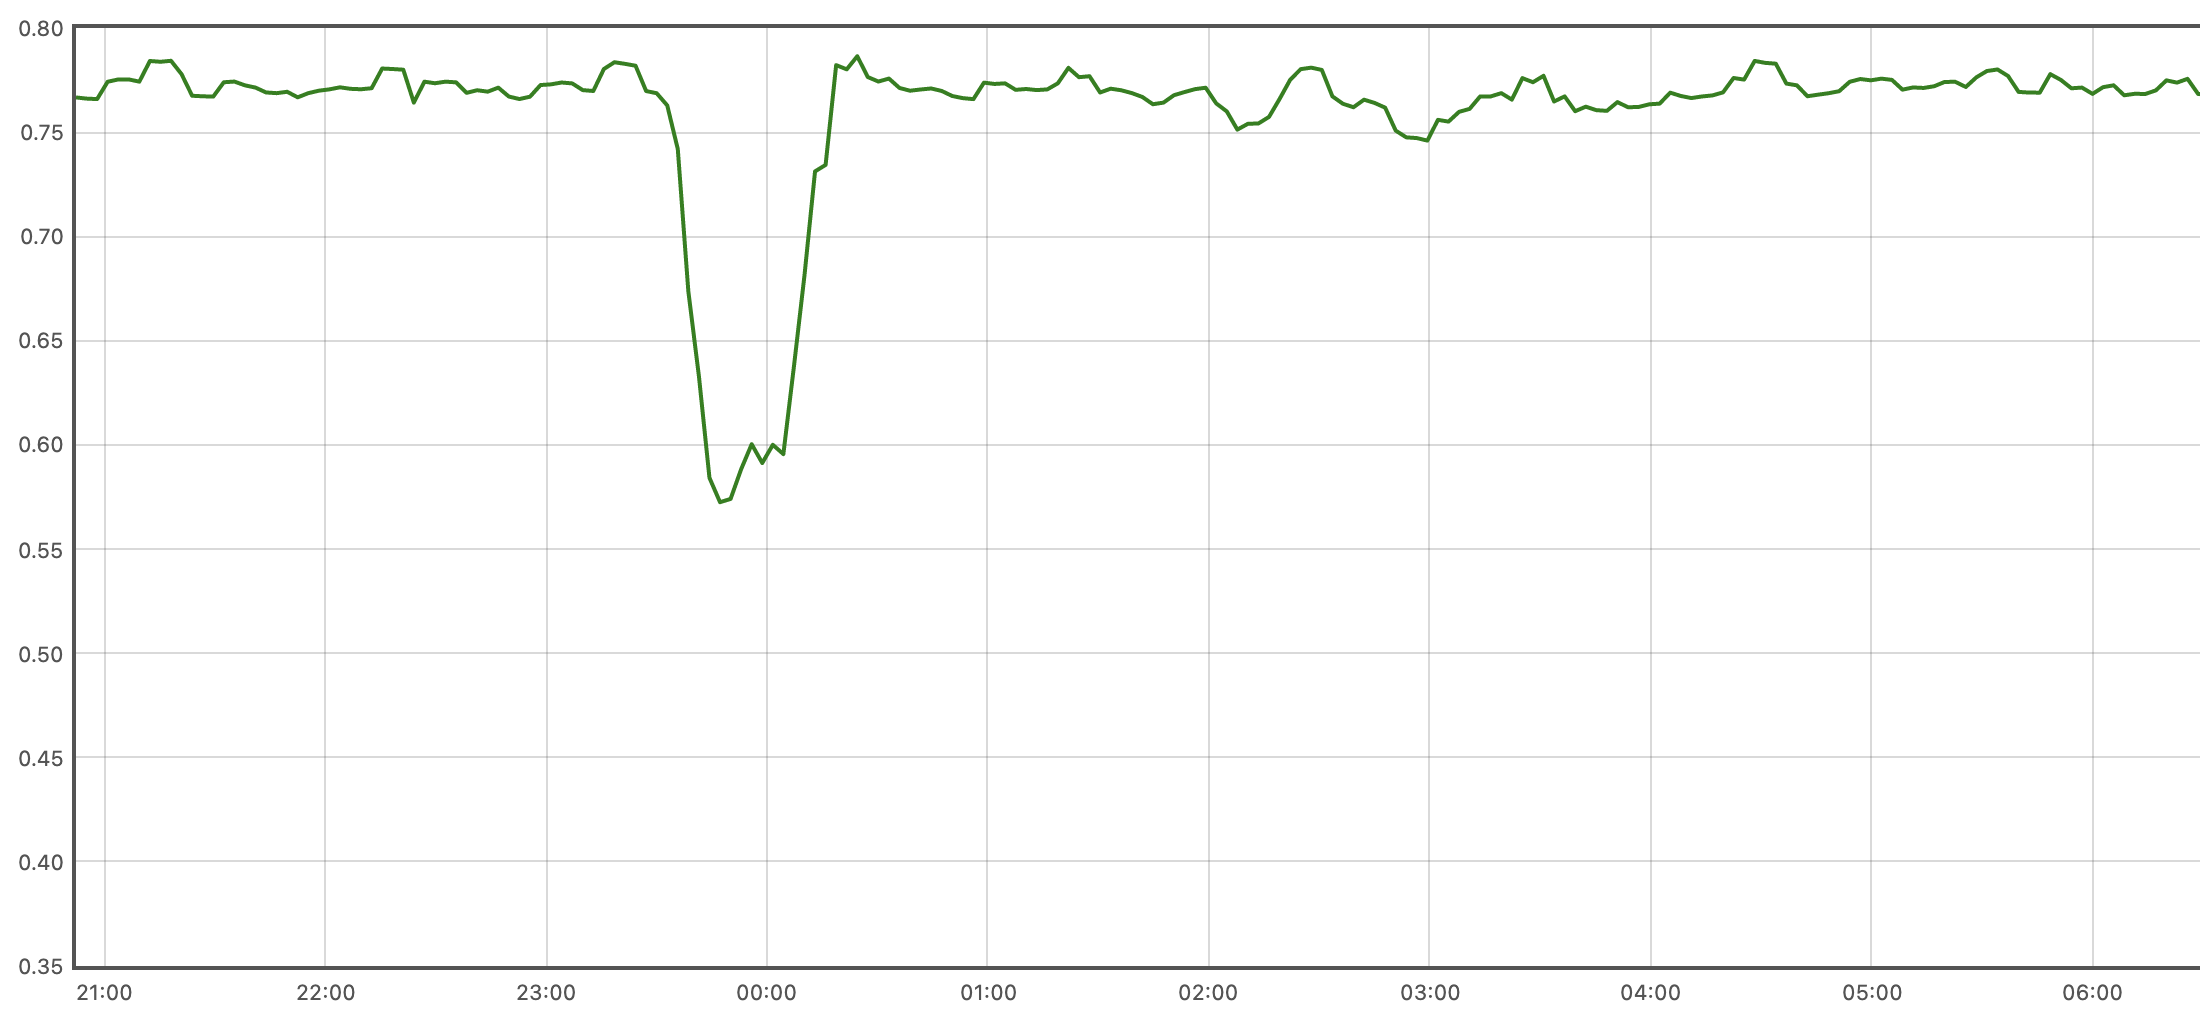
increase(node_cpu_seconds_total{mode="user", instance="redis-sentinel-data-1:9100"}[10m])/on (cpu,instance)(increase(node_cpu_seconds_total{mode="user", instance="redis-sentinel-data-1:9100"}[10m])+ on (cpu,instance) increase(node_cpu_seconds_total{mode="system", instance="redis-sentinel-data-1:9100"}[10m]))
复制得出的mode为User的CPU占用率曲线图如下,与mpstat展示结果相同:

如果有必要的话,可以创建新的指标,用于准确表达CPU占用率。